



Quick Overview
- XRP currently changes hands near $1.09, registering a monthly decline exceeding 6%
- Large transactions above $1M on XRP Ledger plummeted from approximately 70 to merely 2
- Technical indicators overwhelmingly favor sellers, with most moving averages positioned above current price
- Critical support zone between $1.00 and $0.95 remains in traders’ crosshairs
- Breaking beneath $0.90 might trigger a steeper selloff potentially reaching $0.44
Ripple’s XRP maintains a precarious position just above $1.09 on Bitstamp, though momentum has clearly shifted negative across recent timeframes. The digital asset has shed 2.23% over the last day, declined 4.24% across the previous seven days, and dropped 6.83% throughout the past thirty days.
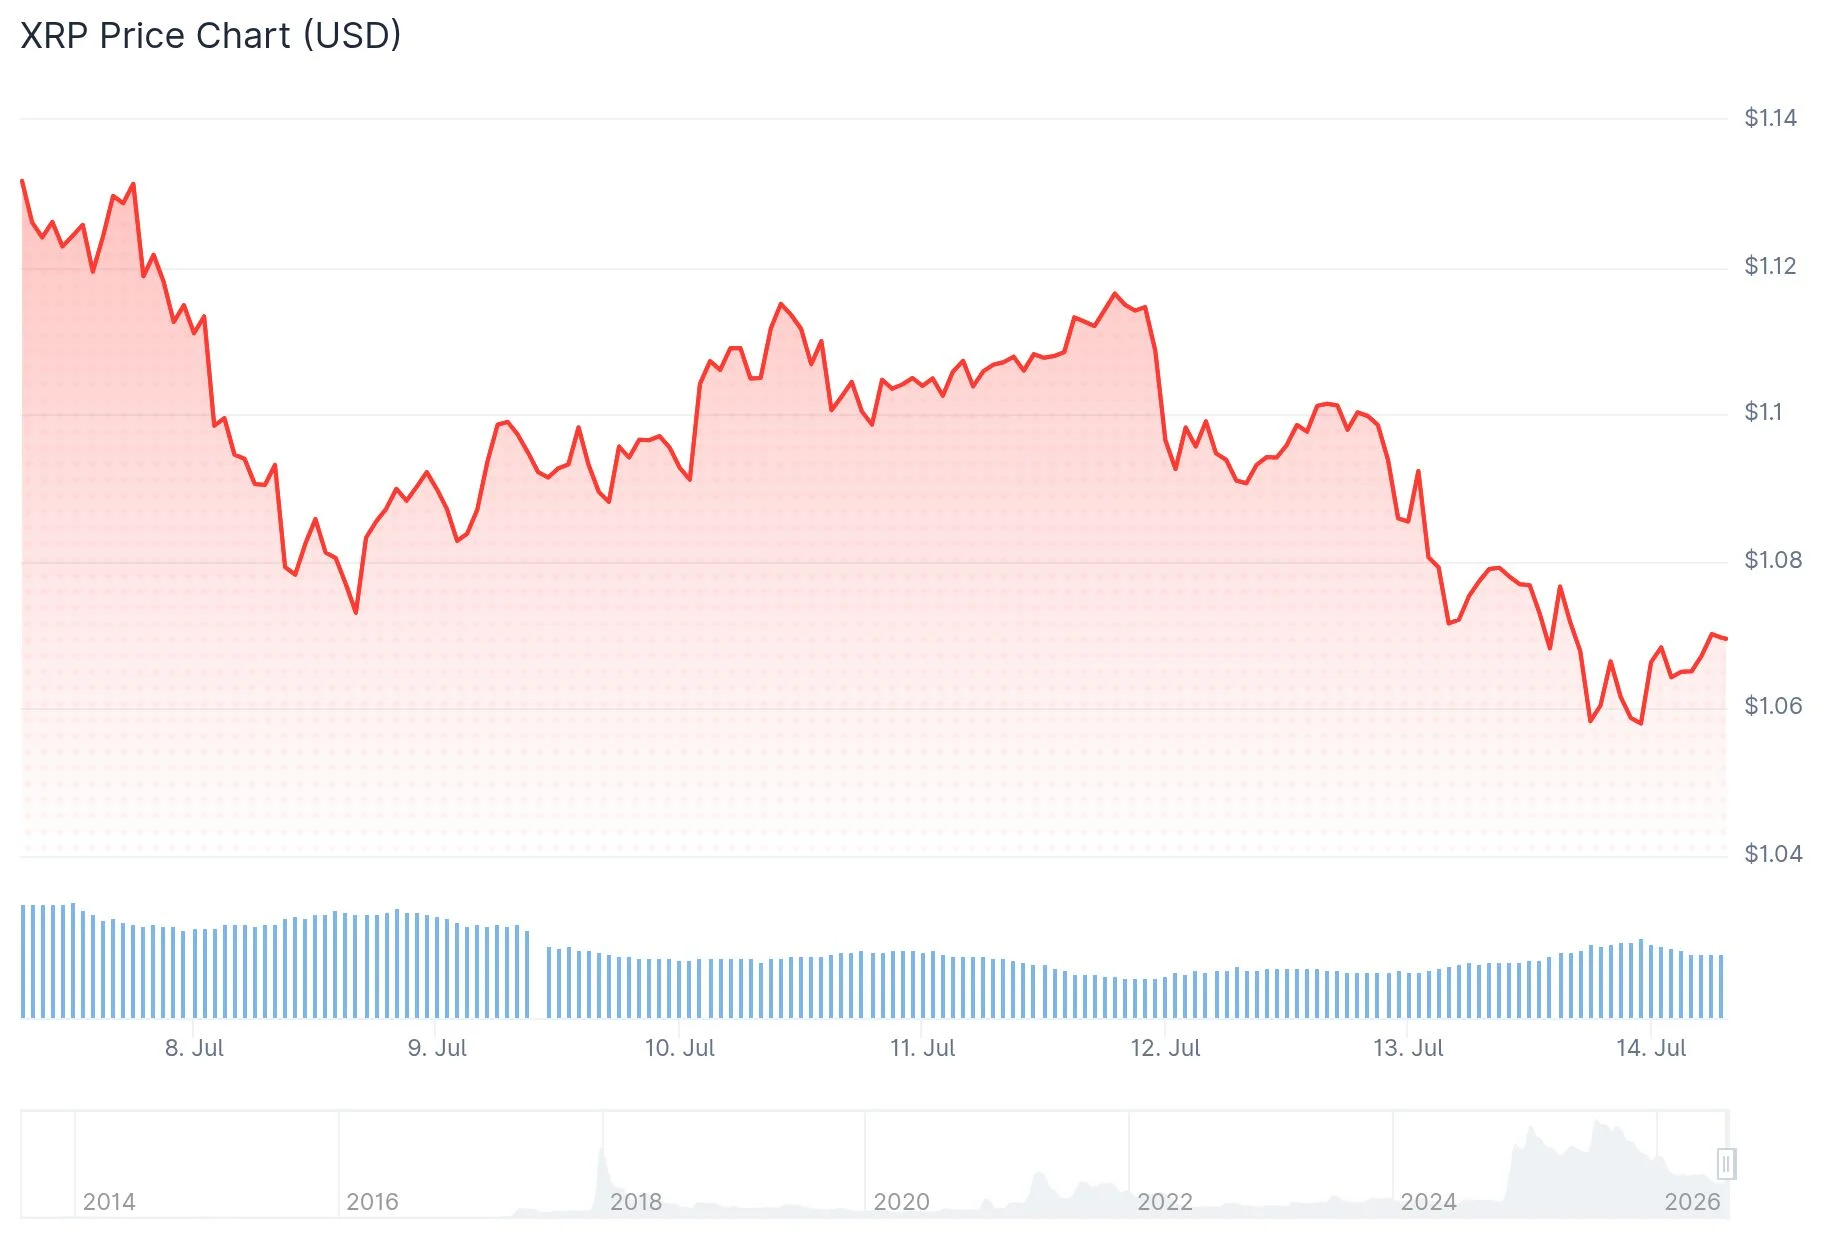
This downward trajectory extends back to August 2025, when XRP reached a local peak of $3.66. The path since has been predominantly bearish.
Market participants are now fixated on the psychologically significant $1.00 level. This price point served as a crucial breakout threshold approximately two years prior, giving it substantial historical importance for traders.
Examining the four-hour timeframe reveals XRP nearing support around $0.95. Technical observers have identified what appears to be an ending diagonal formation — a chart pattern that frequently indicates waning trend momentum.
According to market analyst @ew-forecast, this pattern “could signal that selling pressure is starting to mature,” though they cautioned that the overall market architecture remains bearish absent a definitive reversal confirmation.

Large-Holder Transaction Volume Craters
Blockchain metrics are telling a striking story. Data from Santiment, highlighted by analyst Ali Martinez, reveals that daily XRP Ledger transactions exceeding $1 million collapsed from roughly 70 earlier this week to a mere 2.
This dramatic decline doesn’t necessarily indicate mass liquidation by whales. Rather, it suggests profound inactivity — major stakeholders appear to be observing from the sidelines, awaiting more definitive market signals before committing capital.
Derivatives market Open Interest has similarly contracted, reflecting hesitancy among futures traders to establish firm directional positions. Meanwhile, exchange reserves continue trending downward, which could suggest accumulation behavior, though this doesn’t guarantee imminent price appreciation.
Analyst Celal Kucuker identified an RSI divergence pattern on XRP through his X platform analysis. His assessment was straightforward: “A strong rally could be about to begin.” While this divergence merits attention, it has yet to catalyze meaningful buying activity.
Technical Picture Remains Weighted Toward Sellers
TradingView’s aggregate assessment for XRP registers as Neutral, but the underlying components reveal 14 indicators flashing sell, 10 showing neutral, and only 2 suggesting buy. The Relative Strength Index currently reads 43.45, positioned below the equilibrium threshold of 50. The Average Directional Index registers 14.74, indicating the prevailing trend carries weak momentum.
Critical Price Thresholds Under Observation
Nearly all exponential and simple moving averages — spanning from the 10-period through the 200-period EMA — remain stationed above the current trading price, universally generating bearish signals. The 200-period EMA currently resides at $1.468, considerably above XRP’s present valuation.
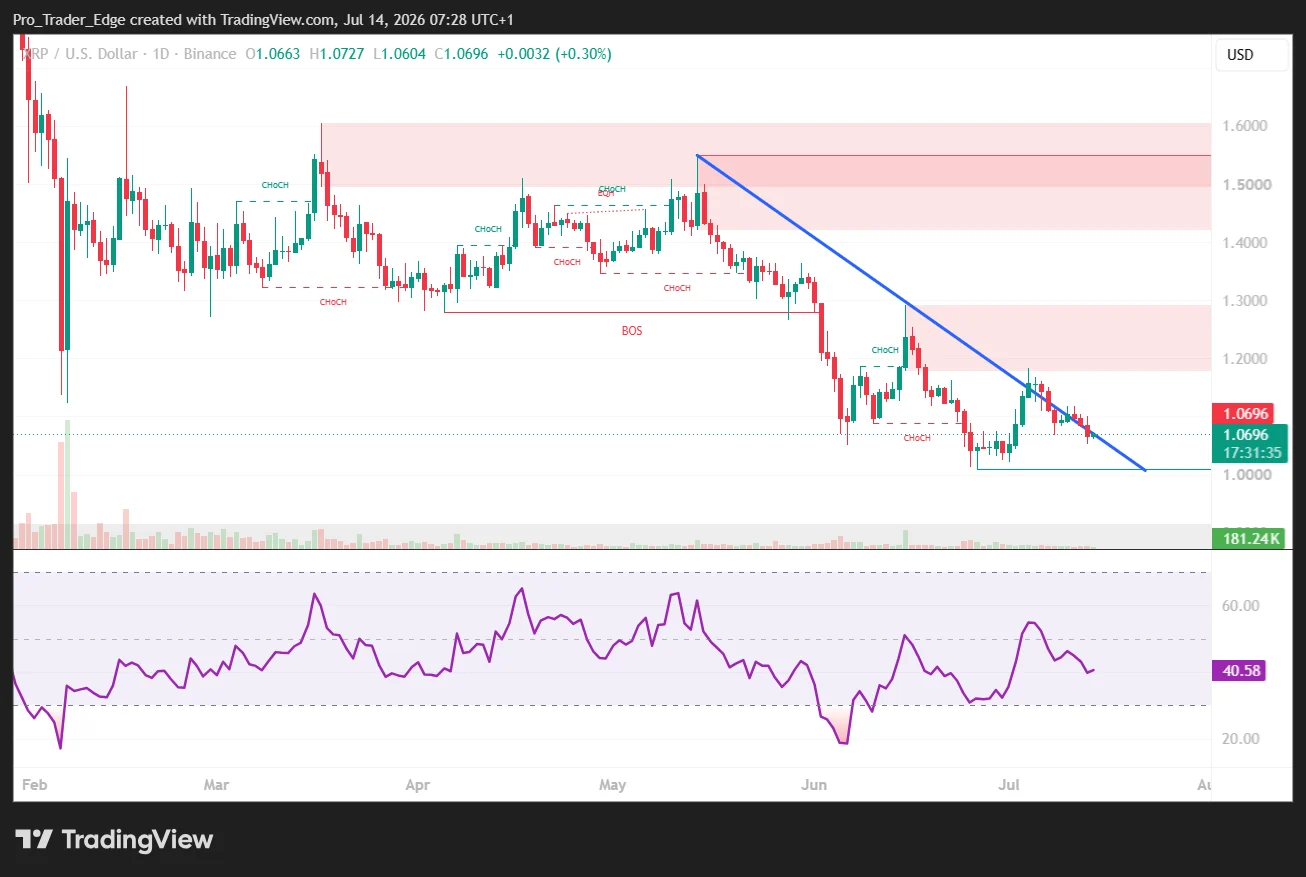
Primary support levels warrant monitoring at $1.00, $0.95, $0.85, and $0.60. Should price action breach $0.90, the subsequent significant support zone could extend as deep as $0.44, according to historical drawdown patterns identified by analyst Chart Nerd from prior market cycles.
Resistance consolidates between $1.10 and $1.13, where multiple moving averages intersect.
The latest blockchain data confirms whale activity has reached exceptionally low levels for this period, with only 2 substantial transactions recorded on the XRP Ledger during the most recent session.
Get 3 Free Stock Ebooks
Discover top-performing stocks in AI, Crypto, and Technology with expert analysis.
- Top 10 AI Stocks - Leading AI companies
- Top 10 Crypto Stocks - Blockchain leaders
- Top 10 Tech Stocks - Tech giants



