


Key Highlights
- HYPE escaped a symmetrical triangle formation on the 30-minute timeframe, currently hovering near $71.25
- Technical analysis points to a measured objective around $76.99, representing approximately 8-9% potential upside
- The Relative Strength Index registers between 55-60, indicating capacity for additional appreciation without overbought conditions
- Crypto analyst AltcoinSherpa anticipates HYPE consolidating within $50-$75 range before potentially climbing to $100
- The platform commands 68.4% dominance in decentralized perpetual futures trading volume
Hyperliquid has successfully pierced through a symmetrical triangle configuration on shorter timeframes, with current trading activity centered around $71.25 USDT. This technical breakout indicates a possible transformation in near-term price dynamics following an extended period of consolidation.
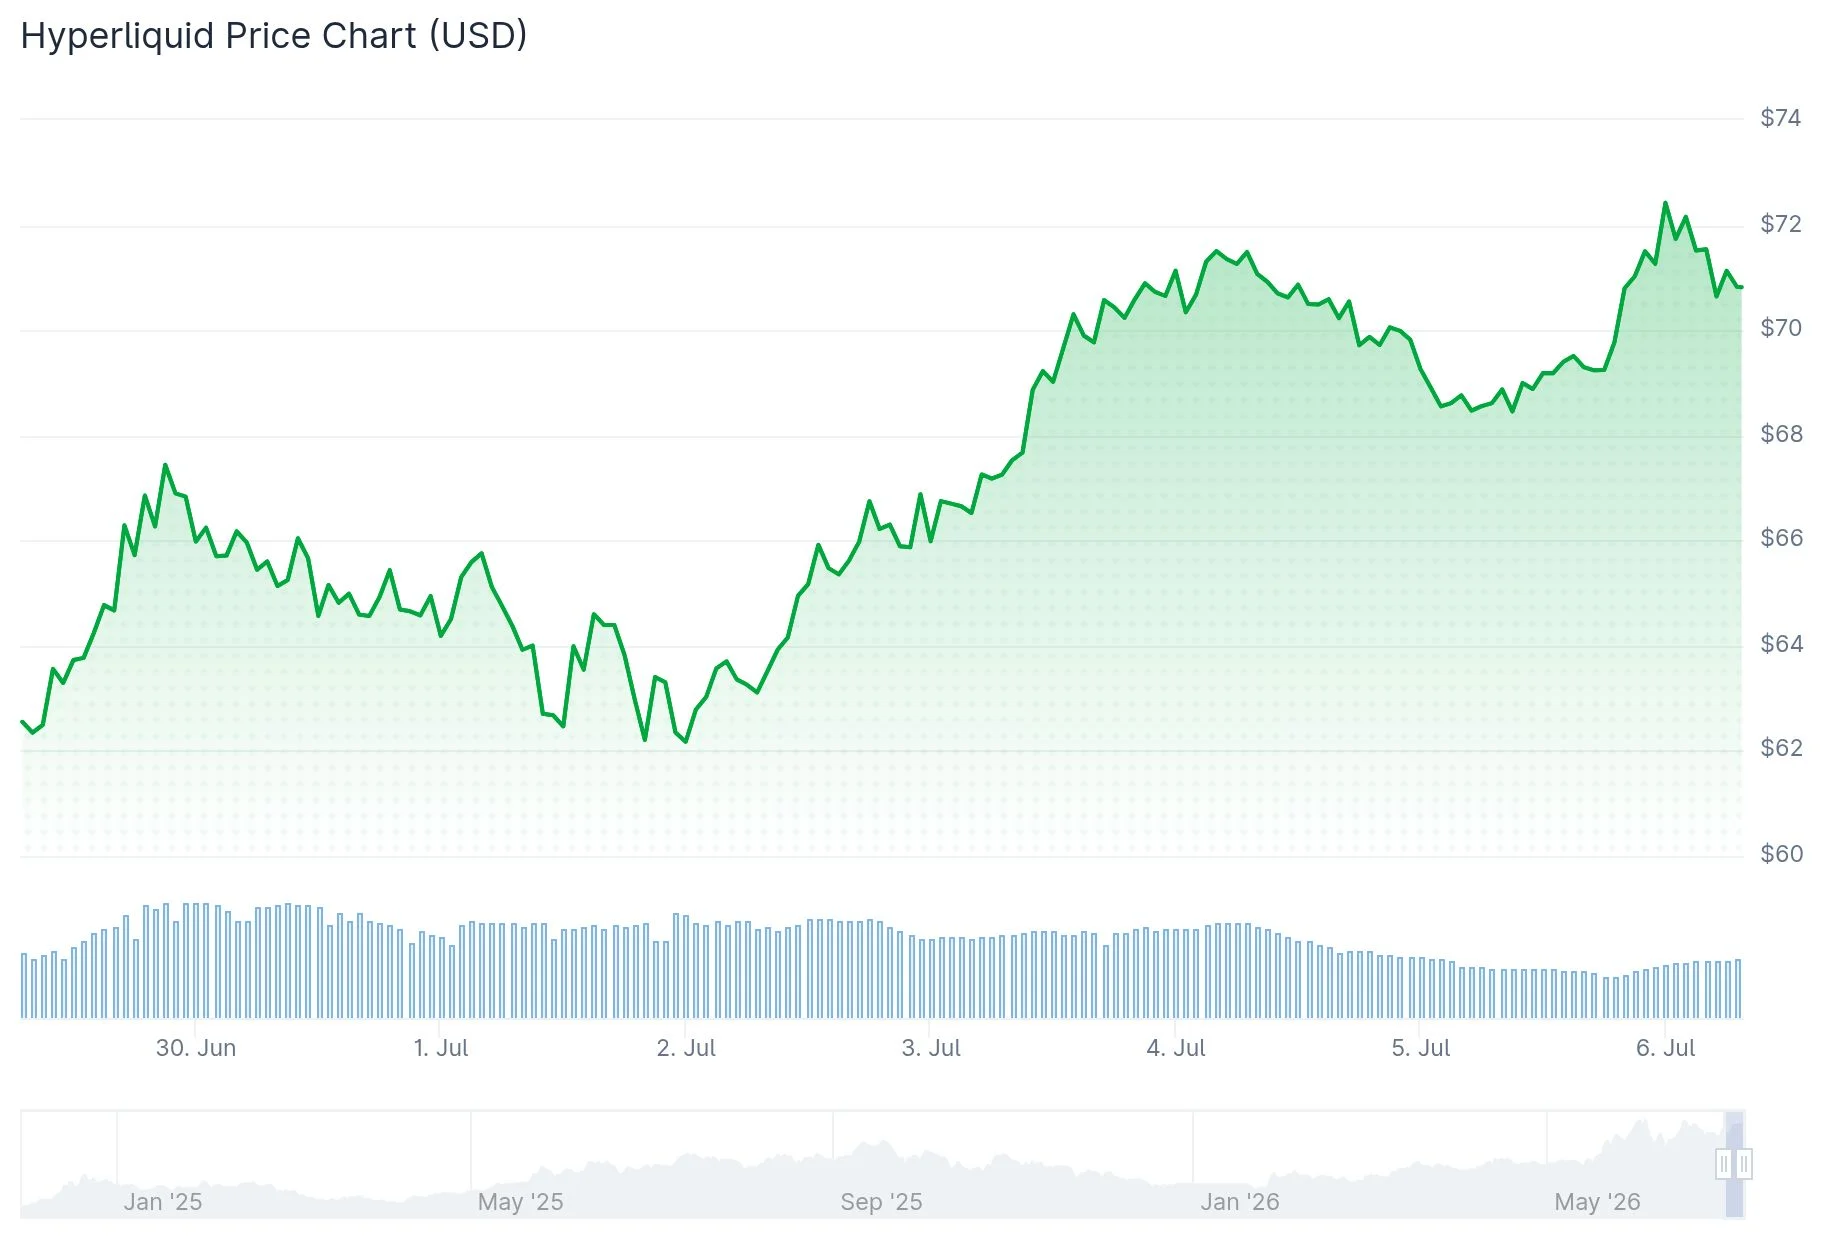
The previous upper boundary of the triangle formation has now converted into a support floor. Market participants are closely monitoring whether HYPE can sustain trading above the critical $67-$68 region, which represents the confirmed breakout threshold.
Looking at resistance levels, $72 represents the immediate hurdle that needs to be overcome. Successfully maintaining momentum above this price point could propel the token toward its calculated target of $76.99, approximately 8-9% higher than the current breakout zone.
The RSI indicator currently fluctuates within the 55-60 band, displaying a neutral-to-positive stance. This measurement suggests additional upward potential exists before the asset approaches overbought conditions typically associated with readings exceeding 70.
Technical Indicator Analysis
The MACD indicator is showing stabilization following a recent retracement phase. Meanwhile, the Stochastic RSI is climbing from oversold territory, reinforcing the argument for renewed accumulation activity.

TradingView’s technical aggregator displays a neutral stance on shorter intervals, while signaling Buy on the weekly timeframe and Strong Buy on the monthly perspective. The overarching trajectory maintains its upward direction.
HYPE remains positioned above its ascending 50-day exponential moving average, which has functioned as reliable dynamic support throughout the latest correction. Both the 100-day and 200-day moving averages continue their upward slopes.
Prominent crypto analyst AltcoinSherpa offered his perspective on X, stating: “$HYPE has been chopping/grinding around for about 1 month and I would like to see it continue in this fashion. The longer something ranges, the stronger the proceeding move after. I’d love to still see this chop between 50-75 over the next few weeks/months and then run to $100.” His analysis emphasizes a patient approach, with an extended consolidation potentially setting the stage for a $100 price objective.
Platform Fundamentals and Market Dominance
Beyond technical patterns, Hyperliquid’s underlying metrics demonstrate considerable strength. The protocol maintains a commanding 68.4% market share of decentralized perpetual contract trading volume. When measured against the entire perpetuals market including centralized venues, Hyperliquid captures 7.4% of total activity.
The platform’s innovative buyback structure allocates 99% of generated trading fees toward HYPE token repurchases from the open market. Approximately 46.8 million tokens, valued at roughly $3.1 billion, have been repurchased since the protocol’s debut in late 2024.
HYPE has recorded gains exceeding 150% over the previous six-month period and approximately 170% on a year-to-date basis. The 52-week trading range extends from $20.52 to $76.70.
Critical support on the downside is located at $58.56, where the recent swing low converges with the 50-day exponential moving average.
Get 3 Free Stock Ebooks
Discover top-performing stocks in AI, Crypto, and Technology with expert analysis.
- Top 10 AI Stocks - Leading AI companies
- Top 10 Crypto Stocks - Blockchain leaders
- Top 10 Tech Stocks - Tech giants



