
 Price Trapped in Month-Long Range — What Triggers the Next 10% Move?")
Key Takeaways
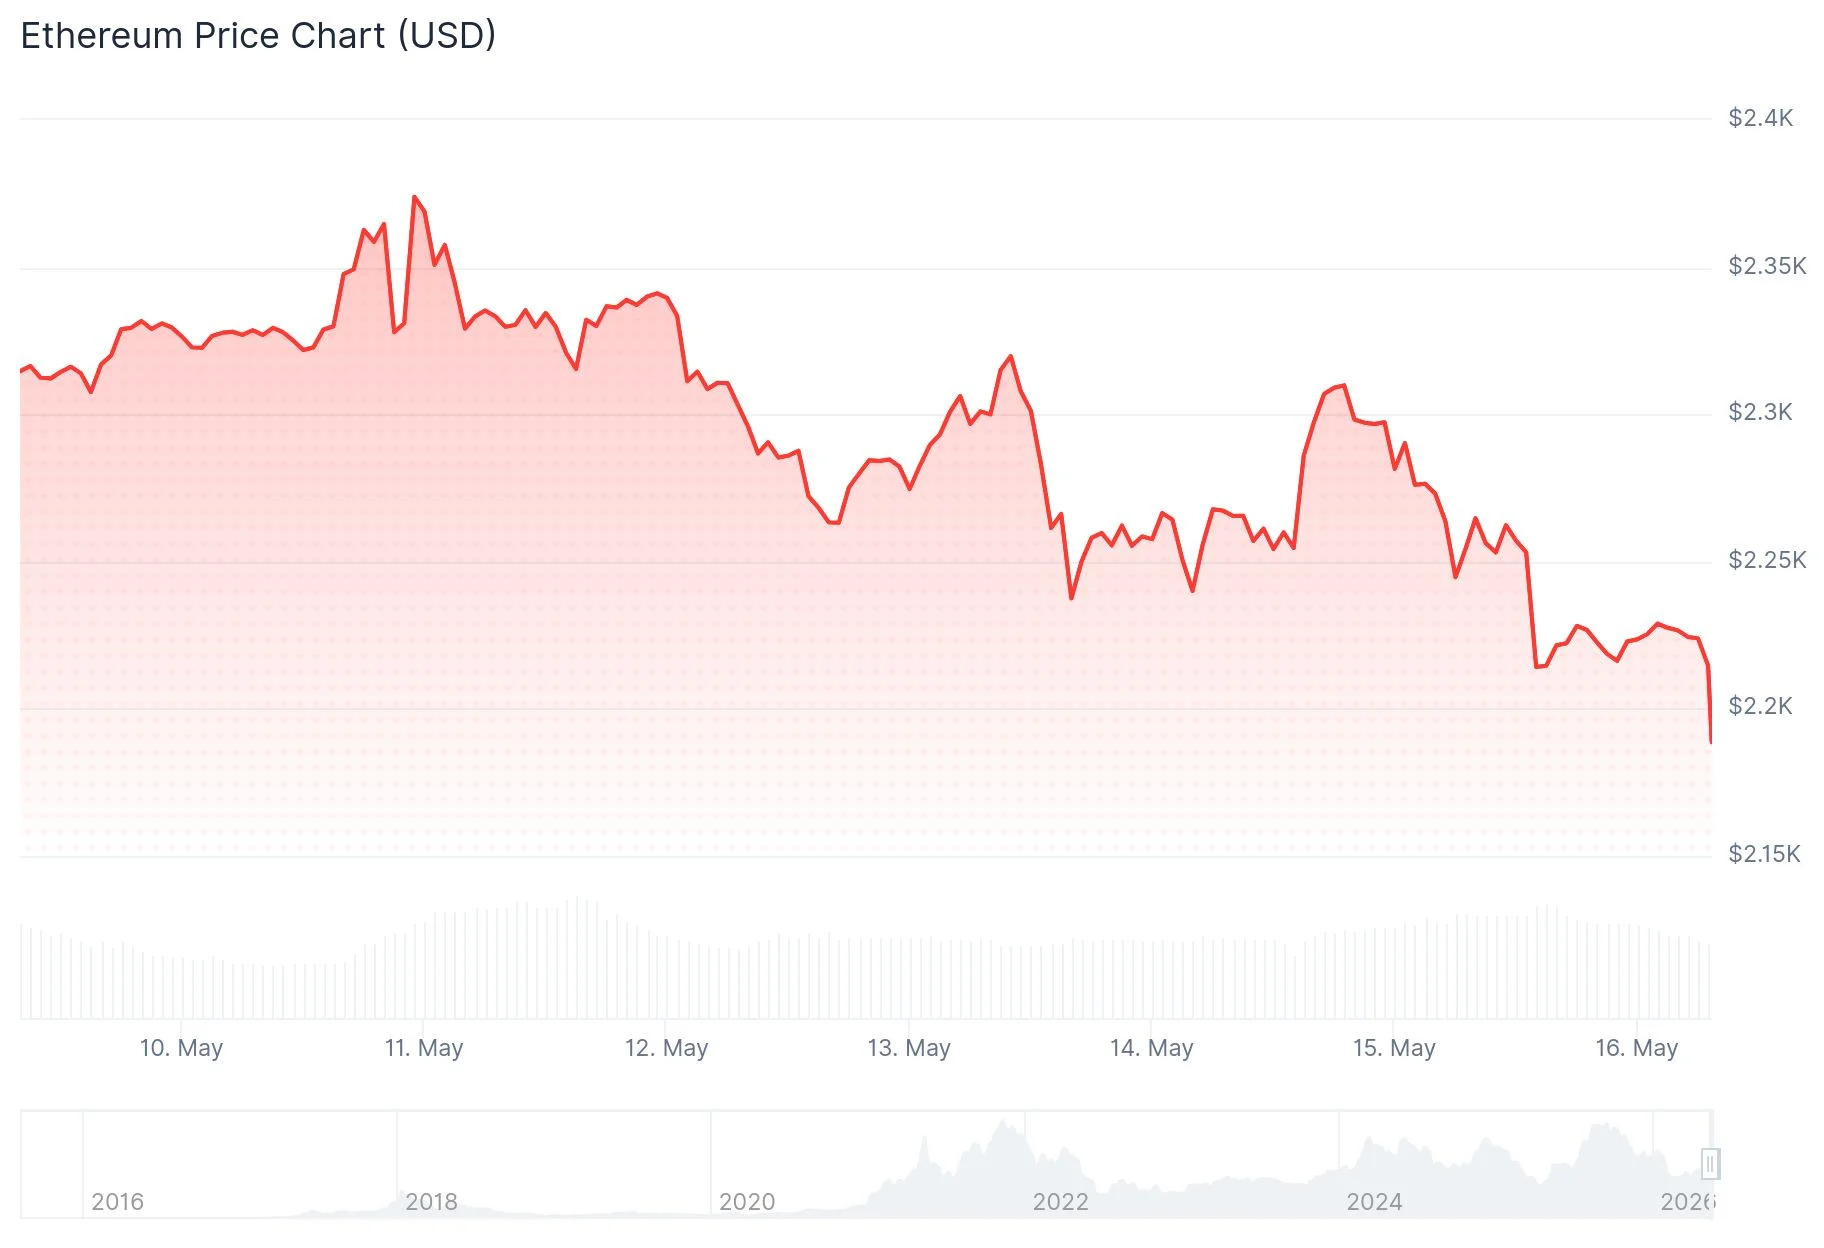
- Ethereum is currently changing hands between $2,226 and $2,263, registering a decline of approximately 3.74–5.5% in recent sessions.
- The Relative Strength Index has slipped under the 50 threshold while MACD remains in negative territory, signaling diminished bullish momentum.
- Market analyst Ali Charts identified $1,071 as a compelling accumulation level located at the channel’s lower boundary.
- For nearly 30 days, ETH has oscillated within a tight $2,250–$2,380 corridor; a decisive break from this range may catalyze a price swing exceeding 10%.
- Crypto analyst Patel projects ambitious upside targets of $5,000, $10,000, and $15,000, while suggesting optimal buying between $1,500 and $2,000.
Ethereum continues to experience downward pressure as technical momentum indicators display bearish signals across multiple timeframes. The digital asset has declined approximately 3.74% during the last 24-hour period, currently trading in the $2,226–$2,263 range based on CoinMarketCap data.
Market commentator Symba observed that ETH has begun responding to its established trading boundaries and suggested correlation with traditional markets. According to his assessment, sustained strength in global equities—specifically the S&P 500—could provide tailwinds for both Bitcoin and Ethereum. His technical chart illustrated ETH climbing above a near-term descending resistance line following successful defense of support at the range floor.
Analyst Ace pointed out buyer intervention following a liquidity sweep around the $2,241.73 low. Following this event, price action advanced into a demand zone near $2,306.87, where significant buy-side interest was absorbed before ETH climbed higher. Current support appears established within the $2,240–$2,250 region.
Blockchain analytics platform Santiment provided additional context through on-chain metrics. The network registered its largest realized profit event in three weeks, totaling approximately $74.58 million, despite price declining roughly 5.5% across a three-day window. Santiment’s analysis suggested this selling activity originated from long-term holders with low acquisition costs rather than fearful retail participants.
Technical Indicators Flash Warning Signs
The Relative Strength Index has retreated to 43.22, falling beneath the neutral 50 mark. Meanwhile, the MACD indicator registers -13.71, positioned below its signal line at 0.52, with the histogram displaying red bars. These technical readings collectively suggest weakening buyer conviction and potential downside testing toward the 100-day moving average situated near $2,145.

Crypto analyst Patel referenced Ethereum’s rainbow valuation model, noting that current price levels place ETH within what he characterizes as a “cheap zone”—a valuation band that has emerged infrequently before substantial upward movements toward profit-taking regions. His recommended accumulation window spans $1,500–$2,000, with extended bull market objectives positioned at $5,000, $10,000, and $15,000.
Contrasting this optimistic outlook, analyst Ali Charts presented a more conservative short-term perspective, publishing on X that $1,071 represents a compelling buy opportunity at the channel’s base.
Critical Range Holds Key to Direction
Trader Daan Crypto Trades outlined the current market structure with precision. Ethereum has remained confined between $2,250 and $2,380 for approximately four weeks, with purchasing activity consistently defending the lower threshold while selling pressure repeatedly caps upside attempts at resistance.
A confirmed breakout above the $2,380–$2,400 zone would transfer control to buyers, potentially initiating a move toward $2,500 and the unfilled CME gap around $2,640. Conversely, a breakdown beneath $2,250 would empower sellers and likely trigger extended consolidation at lower levels.
Current 24-hour trading volume registers $33.17 billion, while market capitalization stands at $268.45 billion.
Get 3 Free Stock Ebooks
Discover top-performing stocks in AI, Crypto, and Technology with expert analysis.
- Top 10 AI Stocks - Leading AI companies
- Top 10 Crypto Stocks - Blockchain leaders
- Top 10 Tech Stocks - Tech giants


