
 Price Hovers Near Critical $0.11799 Fibonacci Level")
Key Takeaways
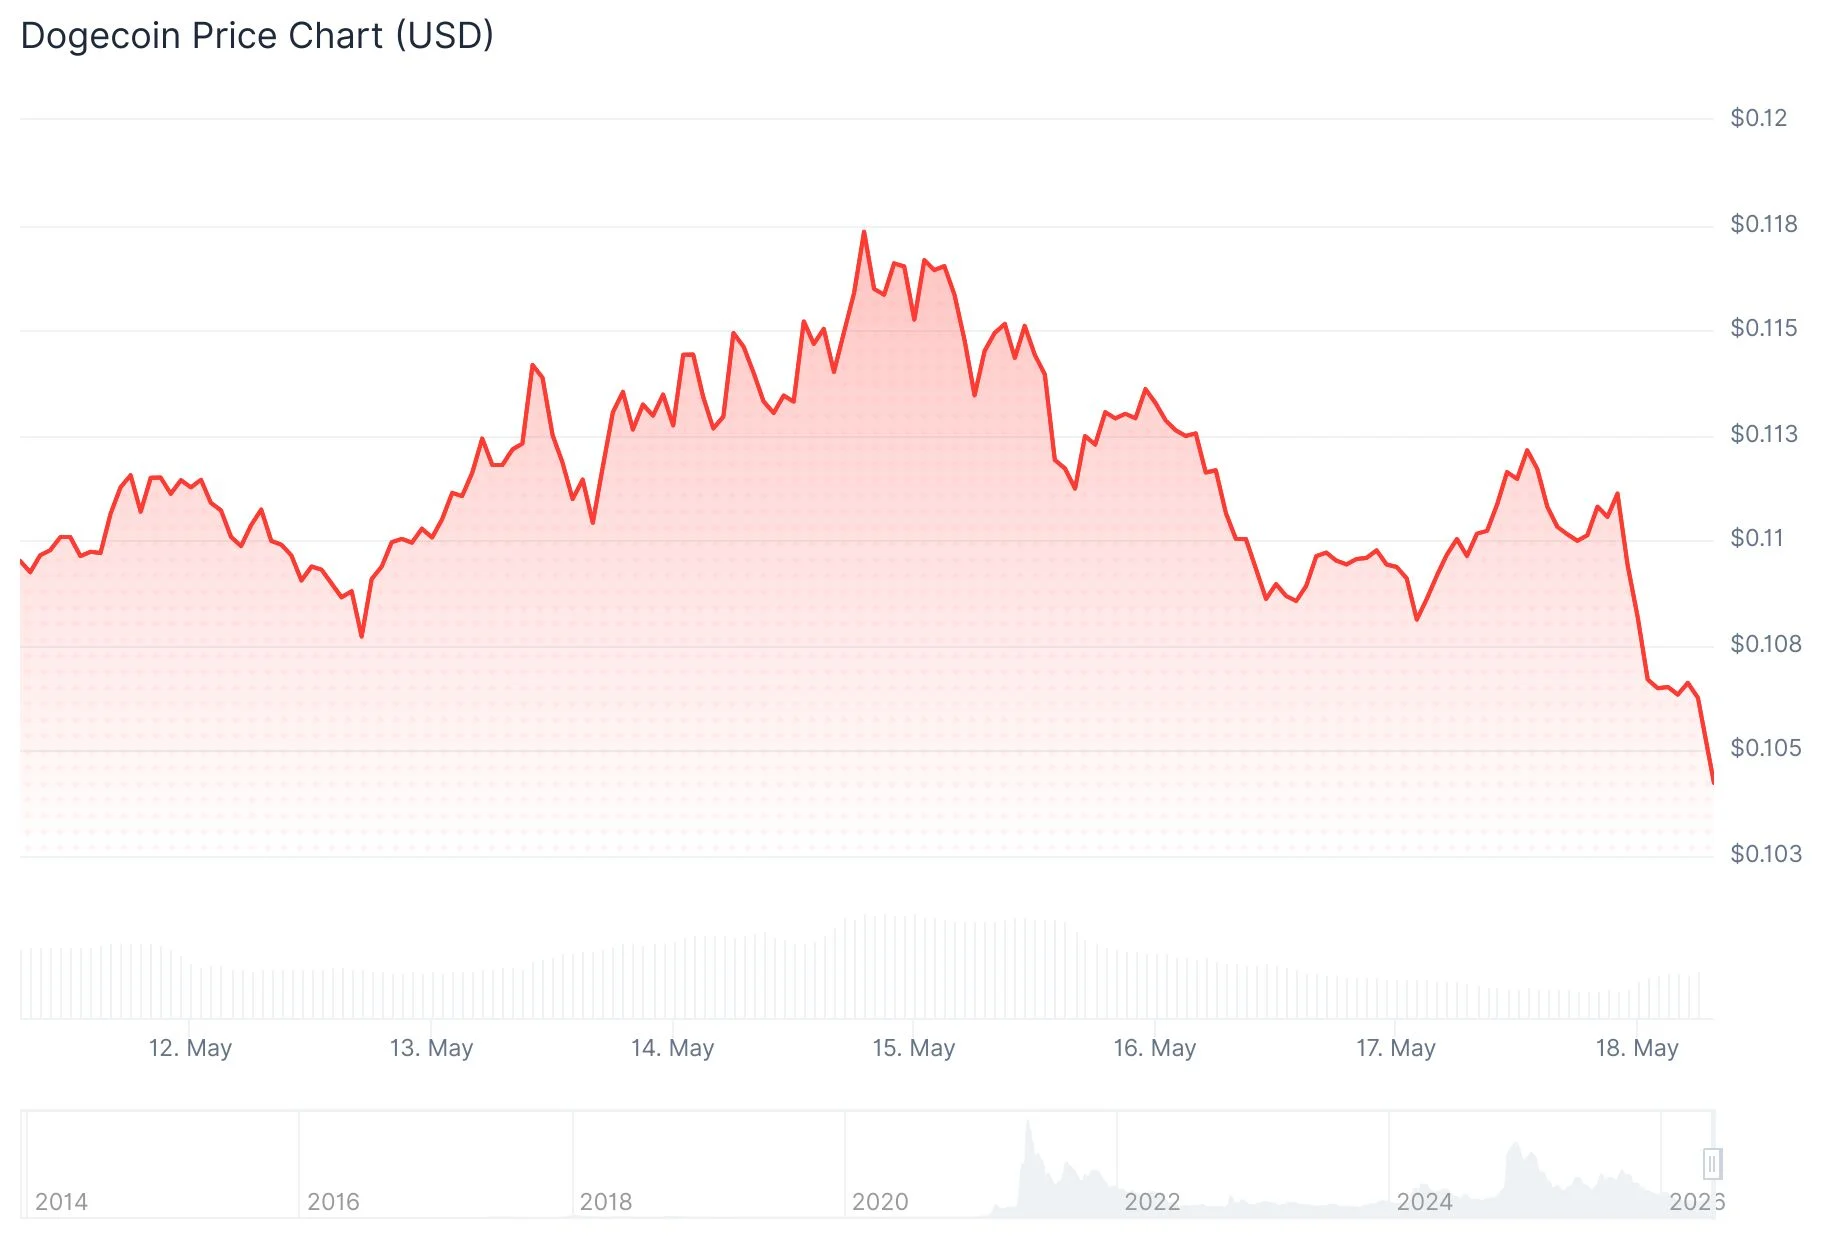
- DOGE currently trades between $0.1102–$0.1105 with an $18.73 billion market capitalization
- The token is consolidating while challenging the 0.618 Fibonacci resistance at $0.11799
- Technical analyst BitGuru identifies a possible rally toward $0.13–$0.15 if bullish momentum continues
- Derivatives market shows declining open interest and volume, while funding rates remain marginally positive
- Analyst Cryptollica draws parallels between current conditions and historical cycle bottoms from 2015, 2020, and 2022
Dogecoin is currently changing hands around $0.1105 as of May 17, 2026, registering a 1.23% increase over the past 24 hours. The meme coin’s daily trading volume stands at $1.29 billion, while its market capitalization remains at $18.73 billion.
The cryptocurrency has been consolidating in a sideways pattern across recent trading sessions. While neither bulls nor bears have established clear dominance, the technical setup is attracting considerable attention from market analysts.
Cryptocurrency analyst BitGuru shared his perspective on X (formerly Twitter) on May 17, highlighting that DOGE has experienced a liquidity flush followed by a period of consolidation. According to his analysis, sustained momentum could propel the price into the $0.13–$0.15 zone. BitGuru emphasized he’s closely monitoring this configuration for potential breakout signals.
Examining the weekly timeframe, DOGE recently found support at the 0.786 Fibonacci level around $0.08042. The price has since recovered and is now testing the 0.618 Fibonacci resistance positioned at $0.11799, which represents the critical threshold to monitor.
Analyst Surf observed that the pullback appears constructive and that the $0.10 level should function as reliable support. His analysis suggests the current chart pattern resembles a 2024 formation, when DOGE rebounded from a comparable zone before initiating a more substantial upward movement.

Critical Price Levels Under Observation
A weekly candle closing above $0.11799 would represent a bullish development. Should this occur, subsequent resistance zones emerge around $0.14 and $0.17, according to the prevailing Fibonacci framework.
Conversely, if DOGE cannot breach this threshold, the $0.095–$0.10 range represents the essential support zone that needs to hold.
Historical Cycle Analysis
Analyst Cryptollica provided a macro perspective by drawing comparisons between the current price structure and previous cyclical bottoms. He characterized historical phases as “disbelief” during 2015, “boredom” in 2020, and “anger” in 2022. His assessment describes the present phase as another sentiment reset, characterized by diminished interest and momentum preceding a potentially significant move.
This analysis doesn’t indicate an imminent breakout but rather provides historical context for understanding where DOGE currently positions itself within broader market cycles.
Regarding derivatives activity, open interest declined 0.79% to $1.52 billion during the last 24-hour period. Trading volume experienced a more pronounced decrease of 39.17%, falling to $1.62 billion—indicating numerous traders are currently adopting a wait-and-see approach.
The funding rate maintained a marginally positive reading at 0.0006%, indicating that some market participants continue anticipating short-term upside potential.
DOGE has yet to confirm a definitive breakout. The 0.618 Fibonacci resistance at $0.11799 remains the most significant test for price action in the immediate term.
Get 3 Free Stock Ebooks
Discover top-performing stocks in AI, Crypto, and Technology with expert analysis.
- Top 10 AI Stocks - Leading AI companies
- Top 10 Crypto Stocks - Blockchain leaders
- Top 10 Tech Stocks - Tech giants


