
 Price Analysis: Support at $0.60 Faces Ultimate Test")
TLDR
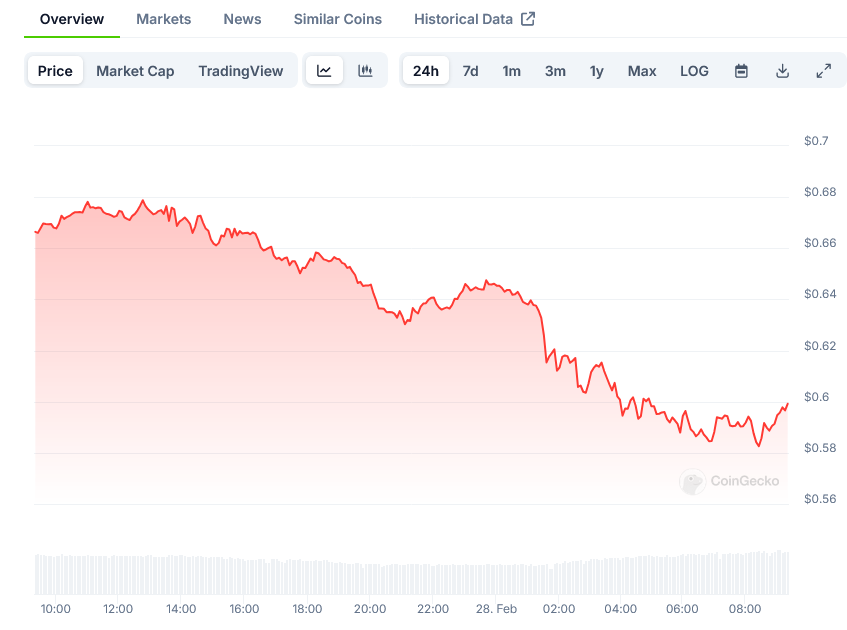
- Cardano’s price has broken down from the $0.70 resistance zone and currently sits at a critical juncture near $0.60
- Market structure shows weakening momentum with multiple failed attempts to reclaim higher levels
- Technical indicators highlight increasing selling pressure as bearish pattern forms on hourly charts
- Support cluster between $0.58-$0.60 represents final defense before potential drop to $0.50
- Trading volume patterns suggest systematic distribution rather than panic selling
The cryptocurrency market continues to demonstrate weakness in the Cardano (ADA) trading pair, with prices retreating from recent attempts to establish support above the $0.70 mark. Technical analysis reveals a deteriorating market structure as buyers struggle to maintain control above crucial price levels.
Recent trading sessions have shown persistent selling pressure, forcing ADA below multiple support zones including the psychologically important $0.65 level. The decline mirrors broader market sentiment, though Cardano’s price action shows distinct technical formations worth noting.
Data from major exchanges indicates that trading activity has maintained steady volume profiles during the descent, suggesting methodical distribution rather than panic selling. This pattern often precedes extended downward moves as larger market participants gradually reduce exposure.
Chart analysis reveals that ADA formed a clear rejection at $0.6769 before initiating the current downward move. The price has since established a series of lower highs and lower lows, a classic indication of bearish market structure.
The hourly timeframe shows price action consistently finding resistance at the 100-period moving average, with each bounce becoming progressively weaker. This technical behavior often precedes further breakdown as buyer exhaustion becomes evident.
Market Analysis
Market participants have noted the formation of a bearish trend line that has capped recovery attempts. This diagonal resistance, currently intersecting near $0.660, has redirected price lower on multiple occasions, reinforcing its technical importance.

Trading data shows that buy orders have begun clustering around the $0.60 support zone, representing the last major defense before the psychologically crucial $0.50 level. Historical price action suggests this area could produce a reaction, though sustained trading below it might accelerate selling pressure.
Volume analysis indicates that selling pressure increases during price bounces, while buying volume remains subdued during dips. This pattern suggests that traders are using relief rallies as opportunities to establish short positions or exit longs.
Technical indicators paint a challenging picture for ADA bulls. The MACD histogram shows expanding bearish momentum, while the Relative Strength Index trades below the midpoint, indicating that sellers maintain control of near-term price action.
Looking at potential price targets, the immediate resistance zone between $0.640-$0.660 has repelled multiple recovery attempts. This area needs to be cleared decisively for any meaningful upside potential to develop.
Support levels have formed clear clusters, with the first major zone between $0.58-$0.60 representing the current battleground between buyers and sellers. A clean break below this area could trigger stop-loss orders and drive prices toward $0.550.
The $0.50 level represents the next major technical and psychological support, where increased buying interest might emerge. Historical trading patterns suggest this level could produce substantial price reactions if tested.
Hourly chart patterns show the development of bearish continuation formations, with each recovery attempt producing smaller bounces. This diminishing strength in relief rallies often precedes acceleration in the primary trend.
Market makers have positioned large order blocks near the $0.60 level, suggesting they anticipate increased volatility as price approaches this zone. The interaction between price and these orders could determine near-term direction.
The most recent price action shows consolidation near support, with declining volume suggesting a decisive move approaches. Traders appear to be awaiting clear directional signals before committing to larger positions.
Get 3 Free Stock Ebooks
Discover top-performing stocks in AI, Crypto, and Technology with expert analysis.
- Top 10 AI Stocks - Leading AI companies
- Top 10 Crypto Stocks - Blockchain leaders
- Top 10 Tech Stocks - Tech giants


