Decentralized finance, or DeFi, lets crypto holders earn income by adding tokens to trading pools. Exchanges such as Uniswap use these pools instead of traditional order books.
People who add tokens are called liquidity providers. They earn a share of the fees that traders pay to swap one token for another.
There is a catch. A provider can earn fees and still end up with less money than if they had simply held their tokens.
This gap is called impermanent loss. This article uses worked examples, formulas and published research to show how large it can get.
All figures assume a standard 50/50 constant-product pool and exclude fees, unless stated otherwise.
| Statistic | Figure |
|---|---|
| Loss when one token doubles in price | 5.72% |
| Loss when one token falls 50% | 5.72% |
| Loss when one token triples in price | 13.40% |
| Loss when one token rises 4x or falls 75% | 20.00% |
| Dollar gap on a $4,000 ETH/USDC deposit when ETH doubles | $343.15 |
| Dollar gap on the same deposit when ETH falls 50% | $171.57 |
What Is Impermanent Loss?
Impermanent loss compares two choices. You can put tokens into a liquidity pool, or you can keep the same tokens in your wallet.

If the pool position ends up worth less than holding, the difference is impermanent loss. It is also called divergence loss.
Uniswap describes it as an opportunity cost. It is the return a provider gives up, compared with holding, when token prices change.
Here is a simple case. An investor deposits 1 ETH and 2,000 USDC when ETH trades at $2,000, so the deposit is worth $4,000.
ETH then doubles to $4,000 while USDC stays at $1. Holding the tokens would now be worth $6,000, but the pool position would be worth about $5,656.85 before fees.
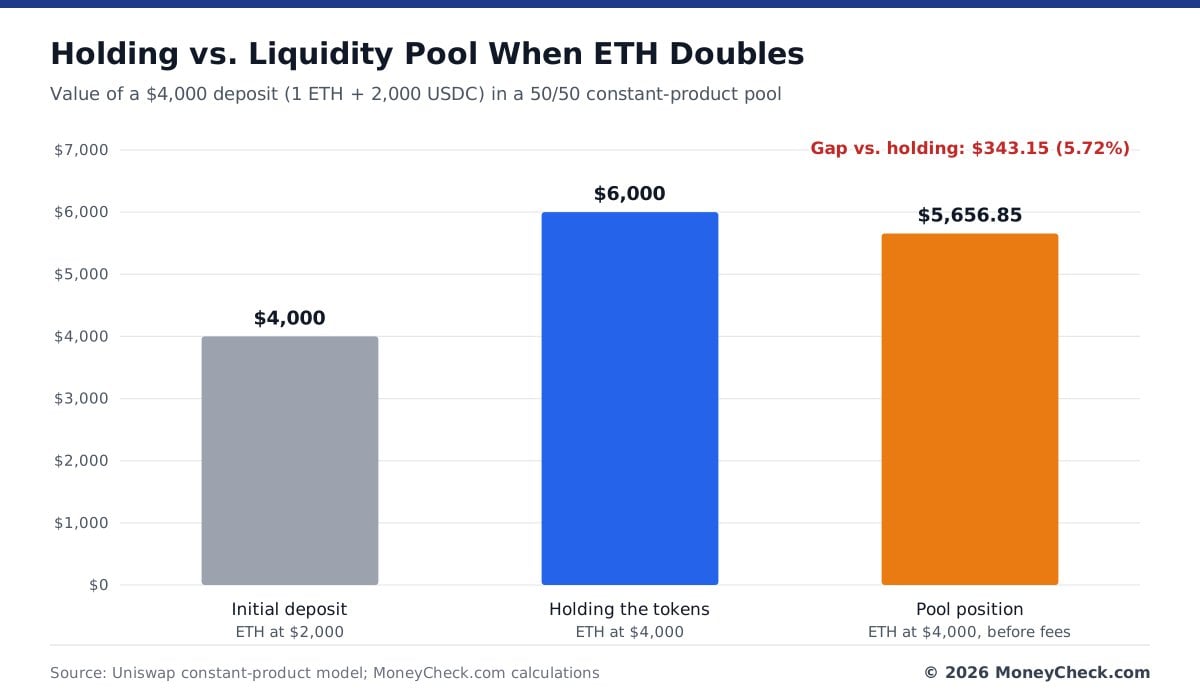
The pool position still gained about $1,656.85. But it trailed holding by $343.15, which is 5.72% of the holding value.
| Outcome | Value | Gain on $4,000 |
|---|---|---|
| Initial deposit | $4,000.00 | n/a |
| Holding the tokens | $6,000.00 | $2,000.00 (50.0%) |
| Pool position, before fees | $5,656.85 | $1,656.85 (41.4%) |
| Gap vs. holding | $343.15 | 5.72% of holding value |
This shows the key point. Impermanent loss measures how far a pool falls behind holding. It does not always mean the investor lost dollars.
Why Pool Balances Change When Prices Move
A liquidity pool is a smart contract that holds two tokens. Traders swap one token for the other, and the balances shift with every trade.
Many pools follow the constant-product formula: x × y = k. In this formula, x and y are the amounts of each token, and k stays the same when fees are ignored.
Take a pool with 10 ETH and 20,000 USDC. The product is 200,000, so a trader who removes ETH must add enough USDC to keep that number fixed.
When ETH rises on other markets, the pool’s price falls behind. Arbitrage traders then buy ETH from the pool until its price matches the wider market.
As ETH leaves the pool, USDC comes in. Providers end up holding less of the token that went up.
When ETH falls, the opposite happens. Traders sell ETH into the pool, and providers end up holding more of the token that went down.
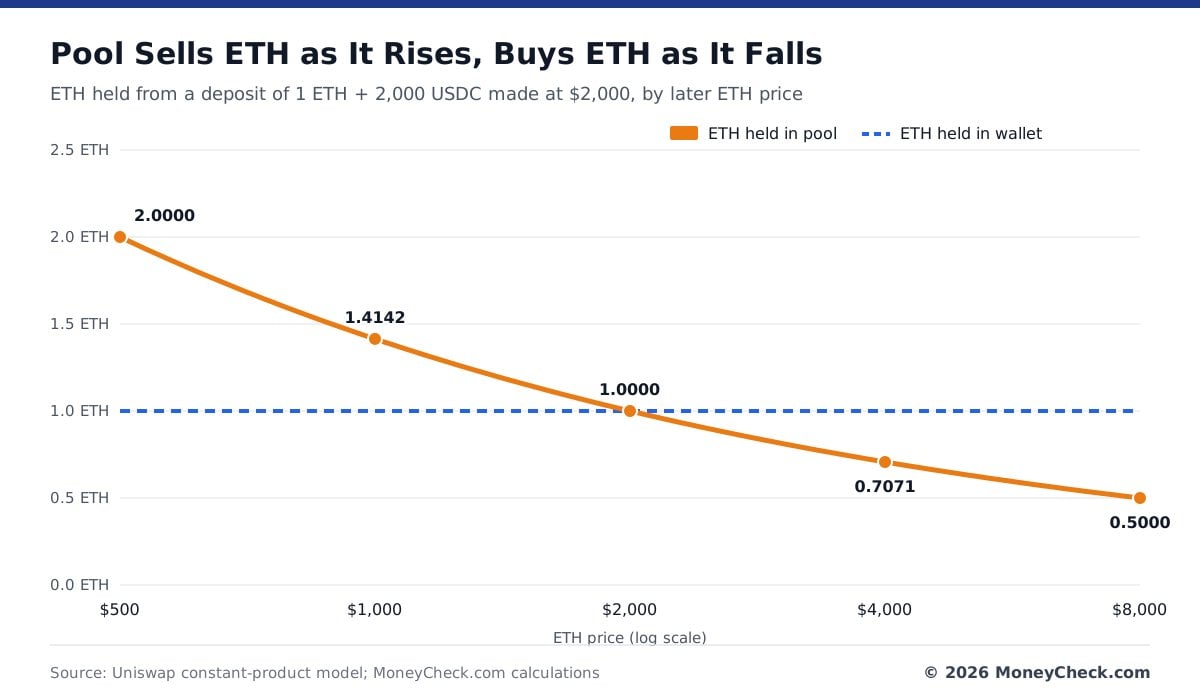
The table below tracks the $4,000 deposit from the earlier example. A wallet holder always keeps 1 ETH and 2,000 USDC, while the pool position changes with the price.
| ETH price | ETH in pool | USDC in pool | Pool value | Holding value |
|---|---|---|---|---|
| $500 | 2.0000 | 1,000.00 | $2,000.00 | $2,500.00 |
| $1,000 | 1.4142 | 1,414.21 | $2,828.43 | $3,000.00 |
| $2,000 | 1.0000 | 2,000.00 | $4,000.00 | $4,000.00 |
| $4,000 | 0.7071 | 2,828.43 | $5,656.85 | $6,000.00 |
| $8,000 | 0.5000 | 4,000.00 | $8,000.00 | $10,000.00 |
Kraken explains that this change in token ratios is the main driver of impermanent loss. It can lower returns even when the provider earns trading fees.
Example: What Happens When Ethereum Doubles
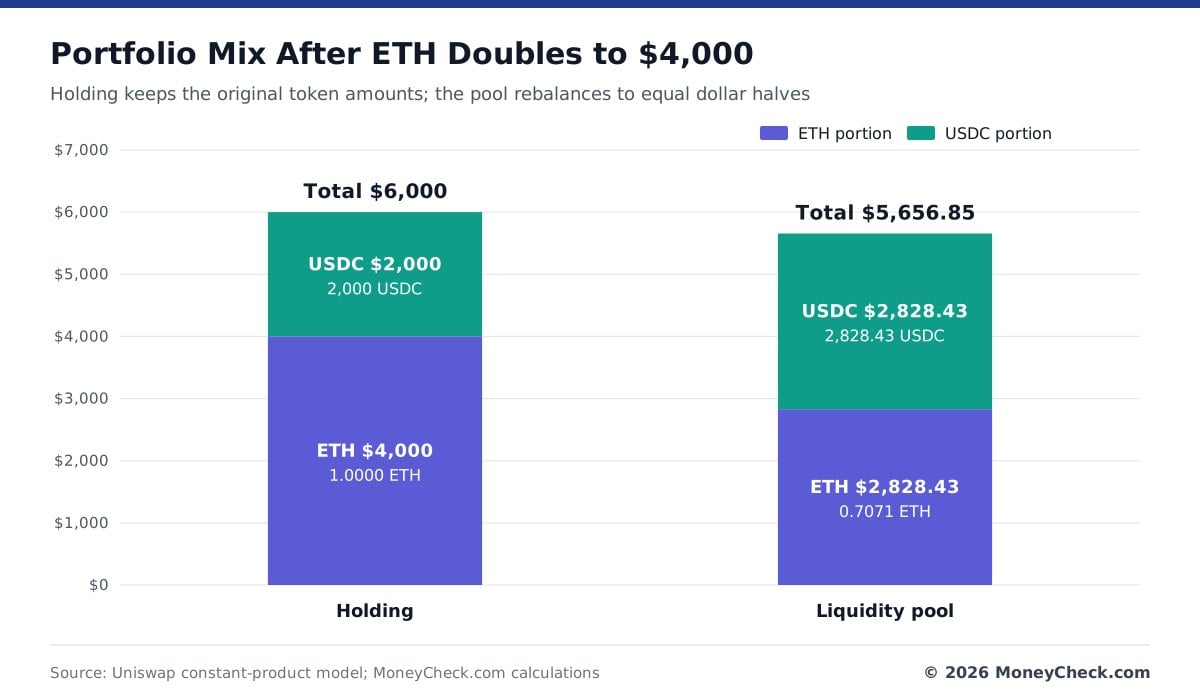
This example uses the same $4,000 deposit in a full-range ETH/USDC pool. ETH starts at $2,000 and rises to $4,000.
A holder still has 1 ETH and 2,000 USDC. That is worth $6,000, a gain of $2,000, or 50%.
The pool provider’s share shifts to about 0.7071 ETH and 2,828.43 USDC. At the new price, each half is worth $2,828.43, for a total of $5,656.85.
| Metric | Holding | Liquidity Pool |
|---|---|---|
| Initial value | $4,000 | $4,000 |
| ETH price after increase | $4,000 | $4,000 |
| ETH held | 1.0000 | 0.7071 |
| USDC held | 2,000.00 | 2,828.43 |
| Final value | $6,000.00 | $5,656.85 |
| Profit before fees | $2,000.00 | $1,656.85 |
| Impermanent loss | None | $343.15 |
To find the loss, subtract the pool value from the holding value. $6,000 minus $5,656.85 equals $343.15.
Dividing $343.15 by $6,000 gives 5.72%. That is the impermanent loss for a doubling in price.
The example assumes no swap fees, no gas costs and no change in the provider’s share of the pool. Real results will differ once those are included.
Example: What Happens When Ethereum Falls by Half
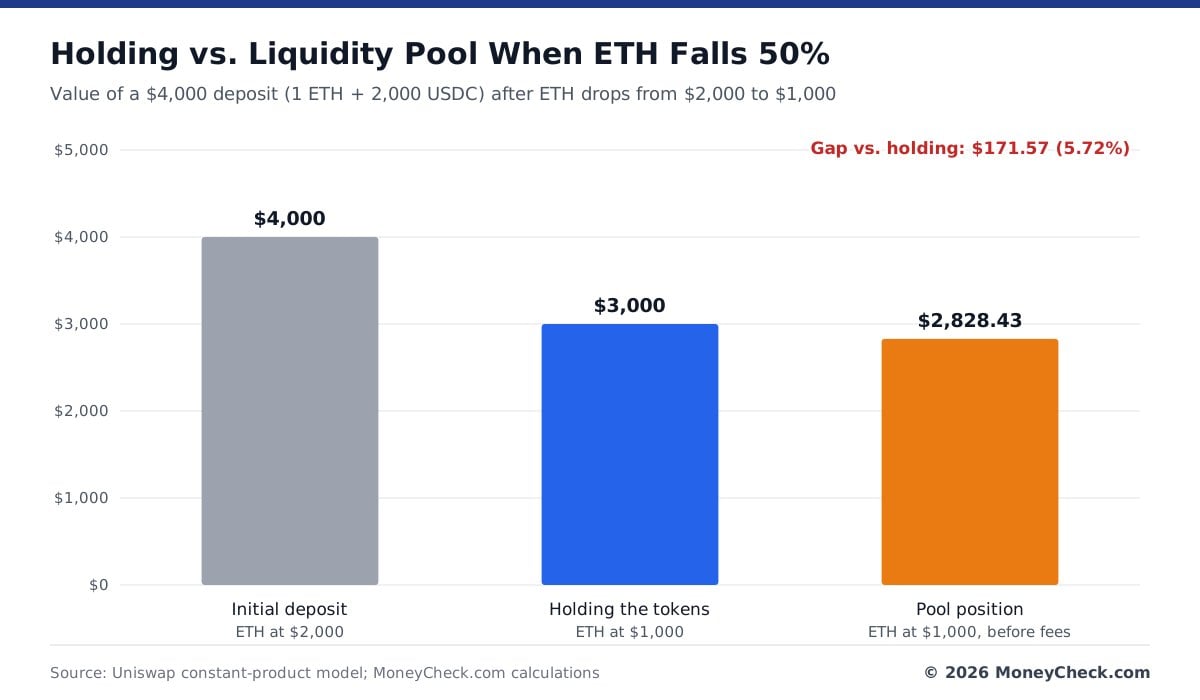
Impermanent loss also happens when prices drop. Using the same $4,000 deposit, ETH now falls from $2,000 to $1,000.
A holder has 1 ETH worth $1,000 and 2,000 USDC worth $2,000. The total is $3,000, a 25% decline.
The pool provider’s share shifts to about 1.4142 ETH and 1,414.21 USDC. That is worth about $2,828.43.
| Metric | Holding | Liquidity Pool |
|---|---|---|
| ETH held | 1.0000 | 1.4142 |
| USDC held | 2,000.00 | 1,414.21 |
| Final value | $3,000.00 | $2,828.43 |
| Change from $4,000 | -$1,000.00 | -$1,171.57 |
| Impermanent loss | None | $171.57 (5.72%) |
The percentage loss is 5.72%, the same as when ETH doubled. But in this case the investor also lost money in dollar terms.
So impermanent loss can stack on top of a falling market. The holder lost $1,000, and the pool provider lost $171.57 more than that.
Why Is It Called “Impermanent”?
The name comes from the idea that prices may return to where they started. If ETH went back to $2,000, the gap between the pool and holding would disappear under the basic model.
Avalanche’s support guide notes that the loss can shrink if the price gap reverses. But there is no guarantee that prices will ever return.
If a provider withdraws while prices are still apart, the loss becomes real. For that reason, it is best treated as a true economic risk, not a temporary one.
Impermanent Loss Statistics by Price Change
Uniswap publishes a formula for impermanent loss in a standard 50/50 pool. It depends only on how much the price ratio between the two tokens has changed.
Impermanent loss = 2√r ÷ (1 + r) − 1
Here, r is the ending price ratio divided by the starting price ratio. If ETH goes from $2,000 to $4,000 against USDC, r equals 2.
Putting 2 into the formula gives 2 × 1.4142 ÷ 3 − 1, which equals −0.0572. The negative sign means the pool trails holding by 5.72%.
| Relative Price Change | Price Ratio (r) | Impermanent Loss |
|---|---|---|
| Token falls 75% | 0.25 | -20.00% |
| Token falls 50% | 0.50 | -5.72% |
| Token falls 25% | 0.75 | -1.03% |
| No relative price change | 1.00 | 0.00% |
| Token rises 25% | 1.25 | -0.62% |
| Token rises 50% | 1.50 | -2.02% |
| Token doubles | 2.00 | -5.72% |
| Token triples | 3.00 | -13.40% |
| Token quadruples | 4.00 | -20.00% |
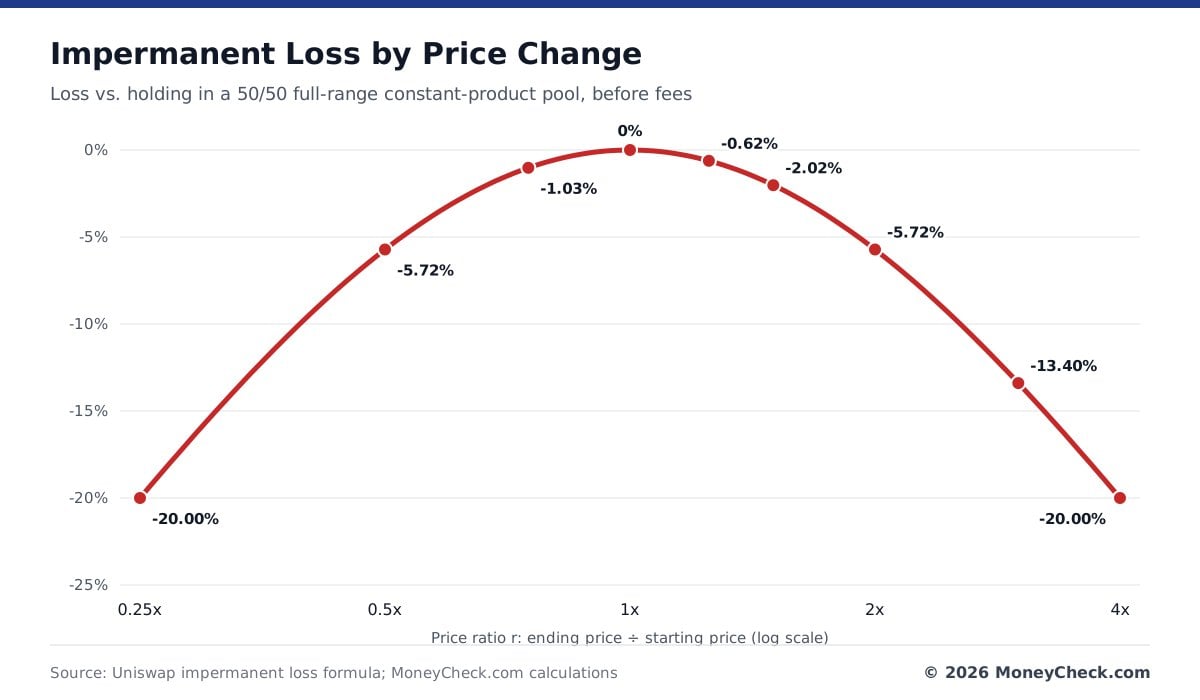
The table shows that losses grow quickly as prices move apart. A 25% rise costs 0.62%, while a fourfold rise costs 20%.
Price moves of the same percentage do not cause the same loss. A 50% rise gives a 2.02% loss, but a 50% fall gives 5.72%.
| Size of Move | Loss If Token Rises | Loss If Token Falls |
|---|---|---|
| 25% | -0.62% | -1.03% |
| 50% | -2.02% | -5.72% |
| 75% | -3.79% | -20.00% |
The math is symmetric for reciprocal ratios instead. A doubling (r = 2) and a halving (r = 0.5) produce the same 5.72% loss.
The formula only applies to full-range, equal-value pools. It also leaves out fees, rewards and gas costs.
Which Liquidity Pools Carry the Most Risk?
Impermanent loss depends on how far two token prices drift apart. So the type of pool matters a great deal.
| Pool Type | Example | Price Drift Risk | Main Extra Risk |
|---|---|---|---|
| Two volatile tokens | ETH paired with a smaller altcoin | High | One token can far outperform the other |
| Volatile token and stablecoin | ETH/USDC | Medium to high | Large ETH moves still cause loss |
| Two stablecoins | Two dollar-pegged coins | Low in normal markets | A coin can lose its peg |
| Correlated assets | ETH and a liquid-staking version of ETH | Low to medium | Issuer, redemption and contract risk |
Stablecoin pairs usually see very little drift. The chart below uses the standard formula to show what happens if one stablecoin loses part of its value.
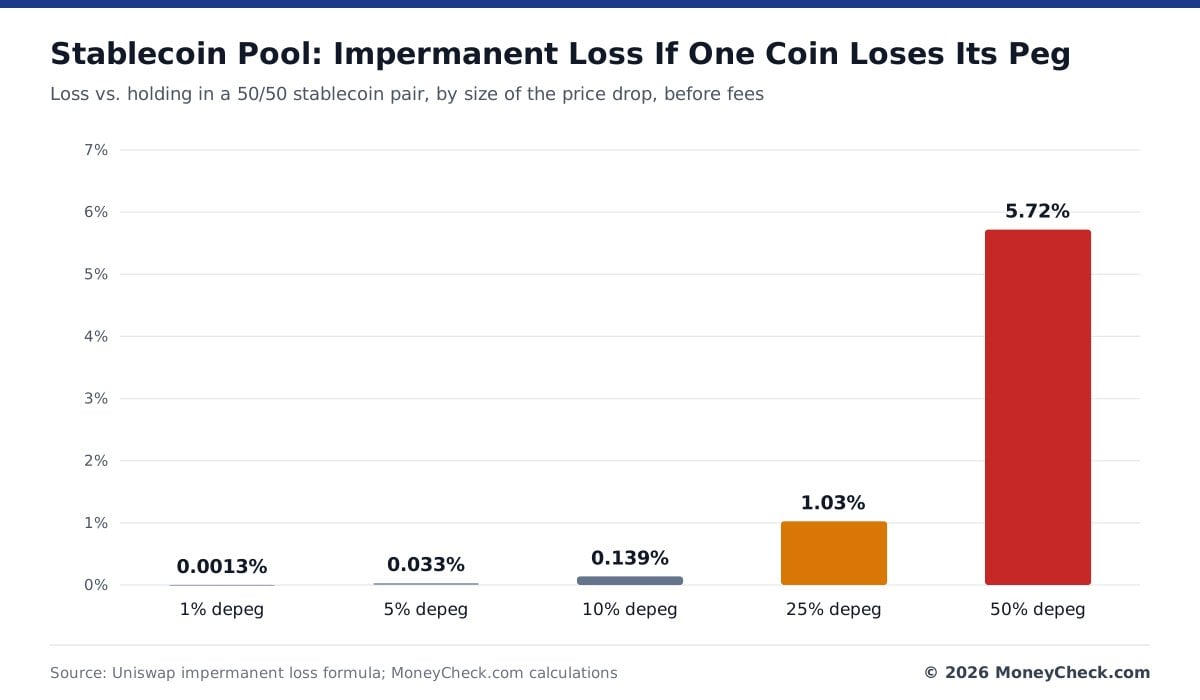
A 1% depeg causes almost no impermanent loss. A 50% depeg causes the same 5.72% loss as an ETH price halving, on top of the drop in the coin’s own value.
How Concentrated Liquidity Changes the Math
Uniswap v3 introduced concentrated liquidity. Providers can place their tokens inside a chosen price range, such as $1,800 to $2,200 for ETH.
A narrow range puts more capital to work near the current price. This can raise fee income while the price stays in range.
But a narrow range also raises exposure to price moves. A narrow-range position can suffer much larger divergence loss than a full-range one, so the standard formula does not apply.
What Happens When a Position Goes Out of Range
If ETH rises above the top of the range, the position turns fully into USDC. If ETH falls below the bottom, it turns fully into ETH.
Uniswap’s documentation confirms that out-of-range positions stop earning swap fees. They start earning again only if the price moves back inside the range.
This means a provider can hold the weaker asset and earn nothing at the same time. Concentrated positions often need active management for this reason.
Can Trading Fees Offset Impermanent Loss?
Trading fees are the main reason people provide liquidity. Each swap carries a fee, and part of it goes to providers based on their share of the pool.
Uniswap says fee earnings depend on trading activity, the pool’s fee setting and how much liquidity is supplied. Fees can offset impermanent loss, but they are not guaranteed.
The table below returns to the ETH doubling example. The holding value is $6,000, and the pool position before fees is $5,656.85.
| Fees Earned | Pool Value With Fees | Result vs. Holding |
|---|---|---|
| $0 | $5,656.85 | -$343.15 |
| $100 | $5,756.85 | -$243.15 |
| $343.15 | $6,000.00 | $0.00 (break-even) |
| $500 | $6,156.85 | +$156.85 |
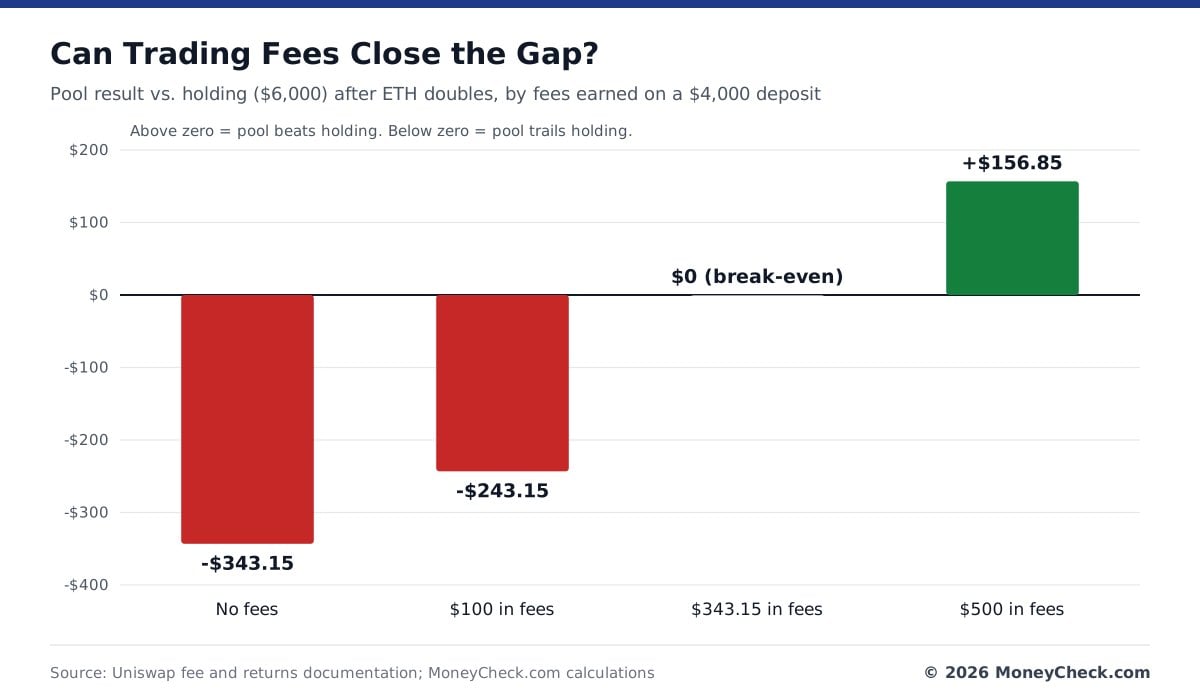
With $500 in fees, the pool beats holding by $156.85. With $100 in fees, it still trails by $243.15.
Fee income can also fall over time. Trading volume may drop, more providers may join the pool, or the fee structure may change.
Reading APR and APY Figures
DeFi platforms often show yields as APR or APY. APR is an annual rate without compounding, while APY assumes earnings are reinvested.
Both figures are estimates, not promises. A pool showing 50% APY may pay much of that in a volatile reward token that could lose value.
Advertised yields also leave out impermanent loss. A 15% gross reward does not mean a 15% return once price changes and costs are counted.
Some high yields come from new reward tokens meant to attract liquidity for a short time. It helps to check whether returns come from real trading activity.
How to Measure Real Liquidity Pool Profit
Impermanent loss is only one part of a provider’s result. A full calculation adds income and subtracts costs.
Net profit = ending pool value + fees + rewards − starting deposit − expenses
Expenses can include gas fees, bridge fees and management costs. Rewards should be counted at their market value, and any extra deposits or withdrawals should be included.
Here is an example of a $10,000 deposit held for three months.
| Component | Value |
|---|---|
| Initial deposit | $10,000 |
| Ending liquidity assets | $10,800 |
| Trading fees earned | $450 |
| Incentive rewards | $150 |
| Transaction expenses | -$50 |
| Final net value | $11,350 |
| Net profit | $1,350 (13.5%) |
| Value if tokens were held | $12,000 |
| Result vs. holding | -$650 |
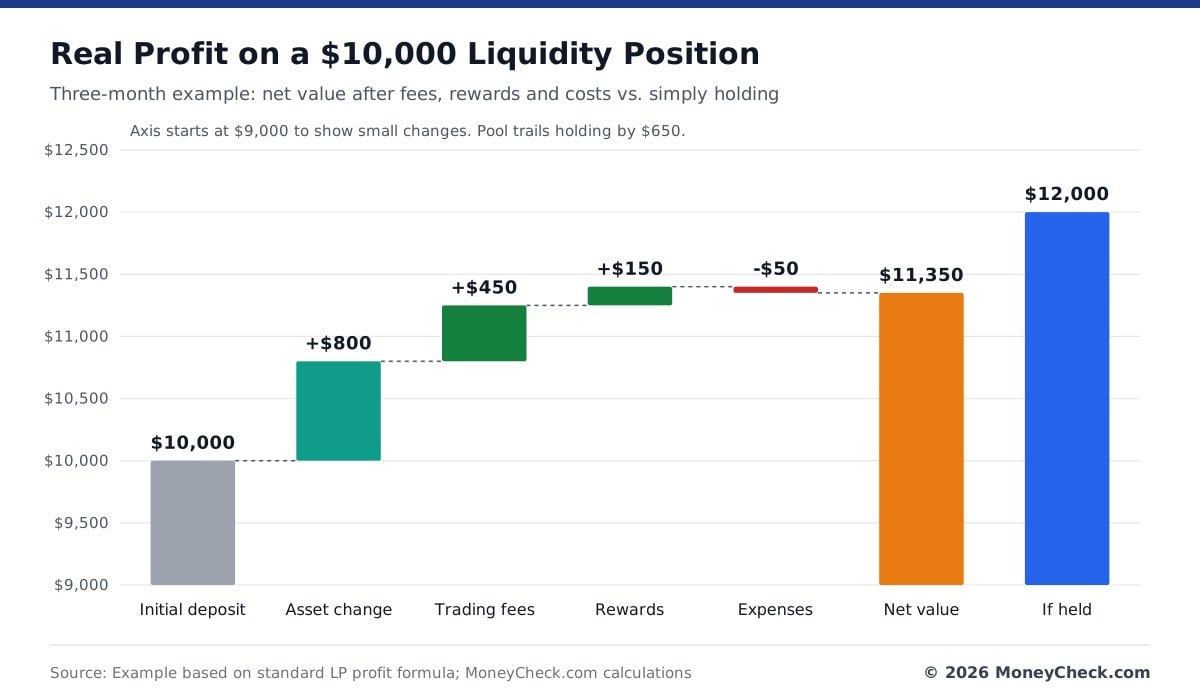
The investor made $1,350, a 13.5% return over three months. But holding the original tokens would have been worth $12,000.
After fees, rewards and costs, the pool trailed holding by $650. Fee income alone does not show whether a strategy worked.
What Research Says About Provider Returns
A Bank for International Settlements working paper from November 2024 studied returns for liquidity providers on decentralized exchanges. It looked at fee income, impermanent loss and transaction costs.
The researchers found that adverse selection is a key cost. Pool prices can go out of date compared with other markets, and arbitrage traders profit from that gap at the expense of passive providers.
The paper also found that transaction costs affect real profit. High trading volume does not mean every provider earns a good return.
Faster and more active traders may also have an edge. Retail providers should not treat a liquidity pool like a bank savings account.
Other Risks Providers Face
Uniswap lists the main risks for liquidity providers. These include impermanent loss, market swings, out-of-range positions, smart contract bugs and untrusted tokens.
Smart contracts can contain coding errors that lead to theft or failures. Audits lower some risks but do not remove them.
Both tokens in a pool can also fall at the same time. A position with little impermanent loss can still lose a lot of dollar value.
Protocol upgrades, fee changes and governance votes can affect users as well. Some pools may also be hard to exit quickly during sharp market moves.
Checklist Before Providing Liquidity
Comparing advertised yields is not enough to judge a pool. The table below lists the main factors to check.
| Factor | Key Question |
|---|---|
| Token volatility | How far could the two prices drift apart? |
| Pool structure | Is it full-range or concentrated liquidity? |
| Trading volume | Is there enough real activity to generate fees? |
| Fee tier | What share of trading fees goes to providers? |
| Incentives | Are rewards lasting or based on new token issuance? |
| Smart contract security | Has the protocol had credible independent reviews? |
| Position management | Will the position need regular monitoring? |
| Transaction costs | What will deposits, withdrawals and changes cost? |
| Holding benchmark | Would simply holding the tokens do better? |
| Investment horizon | Can the investor accept periods of underperformance? |
The holding benchmark matters most. A pool can make money and still be a worse choice than holding if it trails after costs.
Results can also change from one period to the next. A pool that beats holding in a calm market may fall behind when prices swing more.
Final Thoughts
Impermanent loss explains why liquidity providers can earn less than people who simply hold the same tokens. Pools sell some of the rising token and buy more of the falling one as prices move.
In a standard 50/50 pool, a doubling or halving in price causes a 5.72% loss before fees. A fourfold rise or a 75% fall causes a 20% loss.
Fees and rewards can make up for that gap, but only if they are large enough. Comparing a pool’s net result with simply holding is the clearest way to judge whether providing liquidity is worth the risk.
Sources
- Uniswap Developers: Understanding Returns
- Uniswap Labs: What Is Impermanent Loss?
- Uniswap Developers: Concentrated Liquidity
- Uniswap Developers: Fees
- Bank for International Settlements: Liquidity Provider Returns in Decentralised Exchanges
- Kraken: What Is Impermanent Loss?
- Uniswap Labs: What Are the Risks When Providing Liquidity?
- Avalanche Support: What Is Impermanent Loss?
Disclaimer: This article is for information only and is not financial or investment advice. DeFi carries real risks, including price swings, impermanent loss, smart contract bugs and the loss of invested money.