


TLDR
- Standard Chartered analyst Geoff Kendrick maintains a $250 year-end price target for Solana, demanding a 107% rally within three months.
- SOL currently trades around $121, nearly unchanged from February when the prediction was initially published.
- September brought a 40% increase in Solana ETF net inflows, totaling $271 million for the month.
- Network validators approved doubling Solana’s disinflation rate on September 26, reducing the pace of new token issuance.
- Decentralized application fees on Solana exceeded $100 million for consecutive weeks, matching levels last seen in August 2025.
Solana (SOL) hovers around the $121 mark as of October 5, 2026, creating a significant distance from Standard Chartered’s ambitious $250 projection. Analyst Geoff Kendrick originally published this forecast in February, yet the cryptocurrency has struggled to gain meaningful ground toward that level throughout the year.
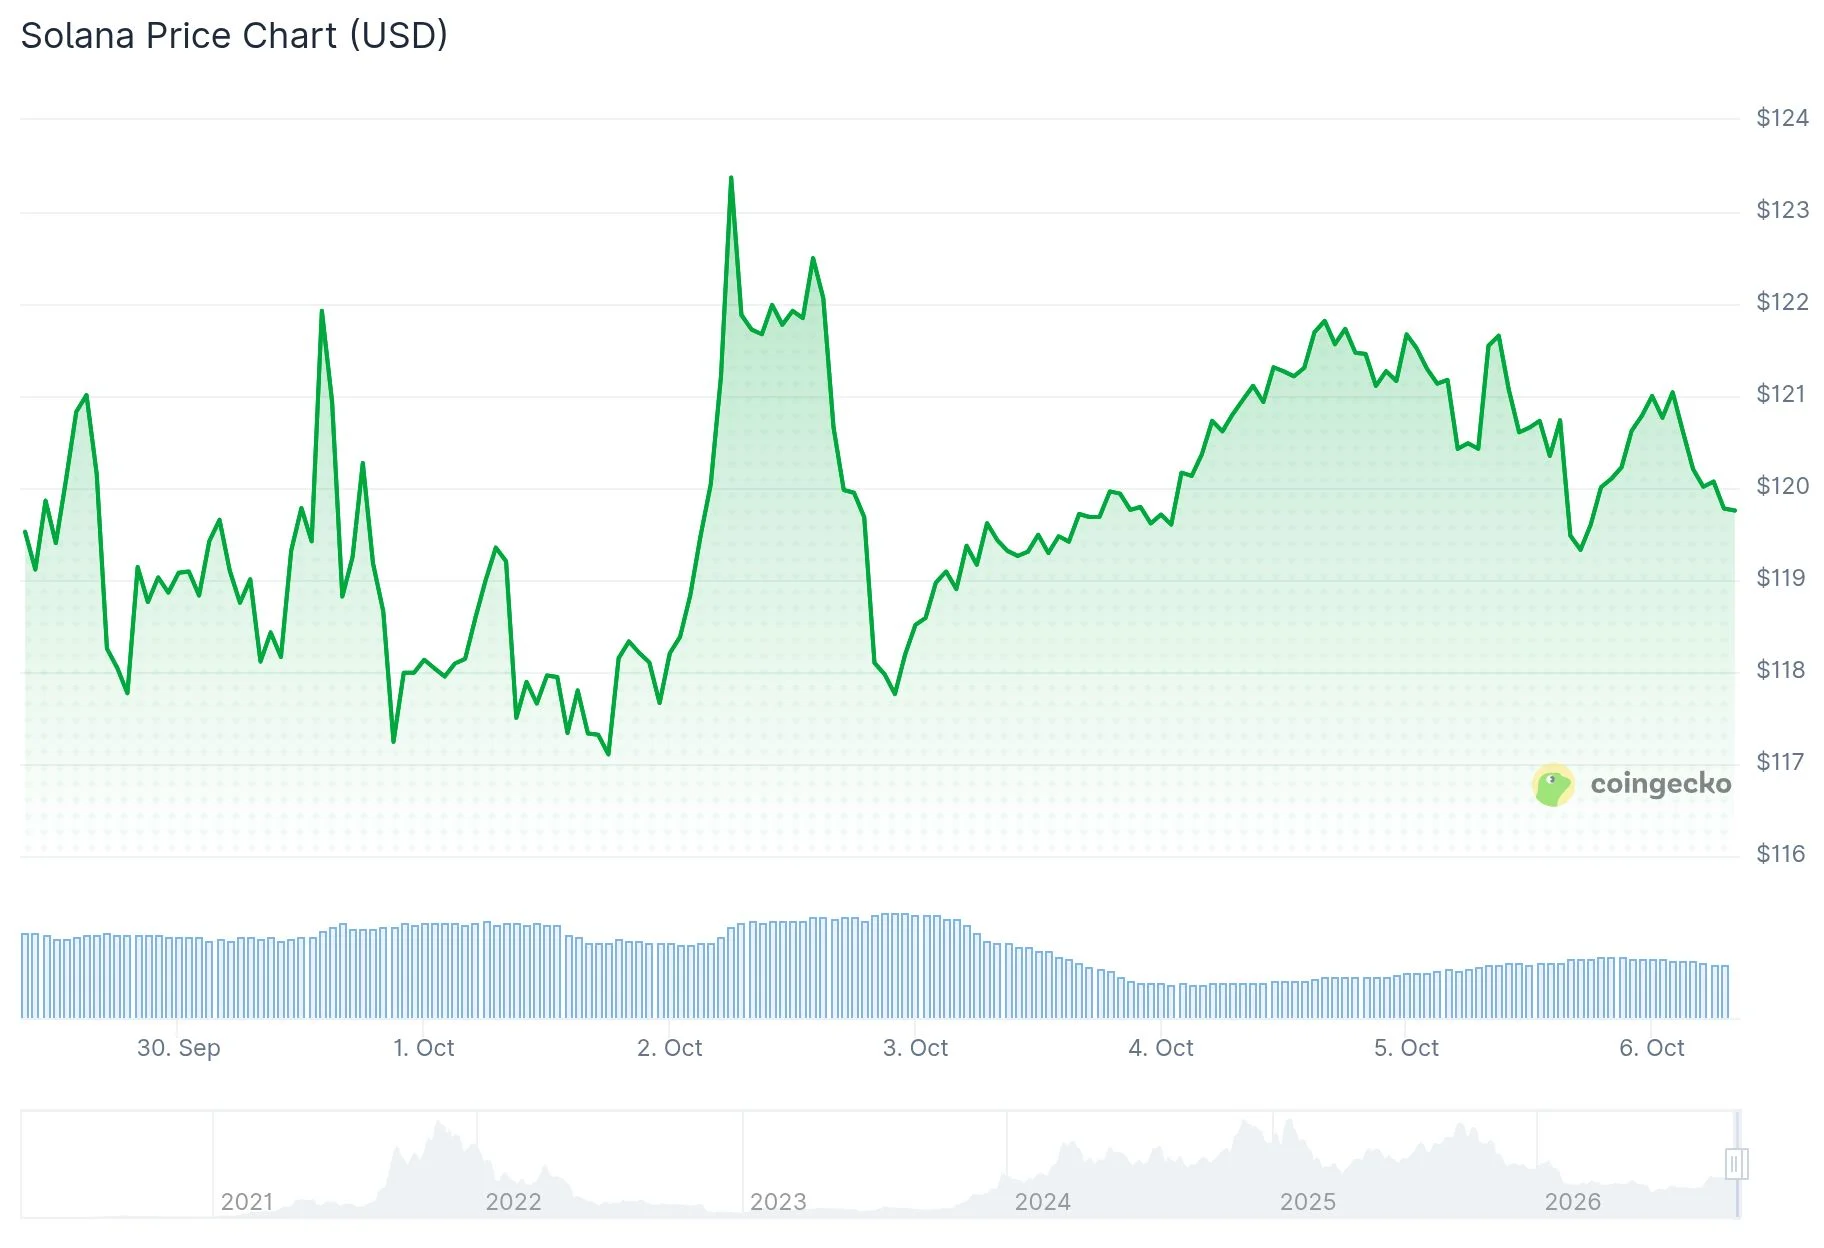
Reaching $250 before the calendar year concludes would require SOL to surge approximately 107% in fewer than 90 days. Such a move would lift Solana’s market capitalization from its present $71 billion to nearly $147 billion.
Standard Chartered revised its 2026 outlook downward in February, reducing the target from $310 to $250. Simultaneously, Kendrick elevated his extended-term projections, establishing a bold $2,000 price forecast for 2030.
Stablecoin Trading Volume Forms Basis of Standard Chartered Analysis
Kendrick’s price projections rely on evaluating the relationship between Solana’s network valuation and the economic throughput occurring on the blockchain. He identified the growing preference for SOL and stablecoin trading pairs on decentralized exchanges as a supporting factor.
The analyst anticipates that AI-powered automated systems will increasingly utilize Solana for microtransactions, capitalizing on the network’s minimal fee structure. Nevertheless, Kendrick acknowledged that Solana might underperform relative to Ethereum during 2026 and 2027 until payment volumes expand sufficiently to generate upward price momentum.

Over the past 30 days, Solana has climbed roughly 18%. Even with this recent appreciation, the token trades 59% beneath its record peak of $293, established in January 2025.
Solana’s available supply currently totals 588 million tokens. With no hard cap on total supply, the network continuously mints new coins as staking rewards, creating ongoing inflation that market participants must absorb during any price advance.
Network validators implemented a decision on September 26 to accelerate the disinflation schedule by twofold. This adjustment reduces the velocity of new token creation, though it doesn’t independently generate buying pressure.
Market analyst Sweep, operating under the username @0xSweep, observed that Solana appears to be replicating a cycle witnessed in the previous month. He characterized the token’s movement as alternating between expansion and accumulation phases, indicating SOL presently occupies the accumulation zone. Sweep suggested a potential retracement toward $110 before the next upward movement initiates.
Investment Product Flows and Blockchain Metrics Display Positive Trends
Cumulative inflows into Solana-based exchange-traded funds climbed 40% throughout September, totaling $271 million versus August’s $194 million. Current SOL trading volume measures $2.3 billion, representing approximately 3.2% of its circulating valuation.
The count of unique active addresses on Solana’s blockchain has demonstrated consistent growth. Analytics platform Santiment identifies a constructive crossover between the 30-day and 50-day moving averages for this indicator.
Revenue generated by Solana’s decentralized applications, notably Pump.fun, surpassed $100 million for the second consecutive week. Fee generation at this magnitude hasn’t occurred since August 2025.
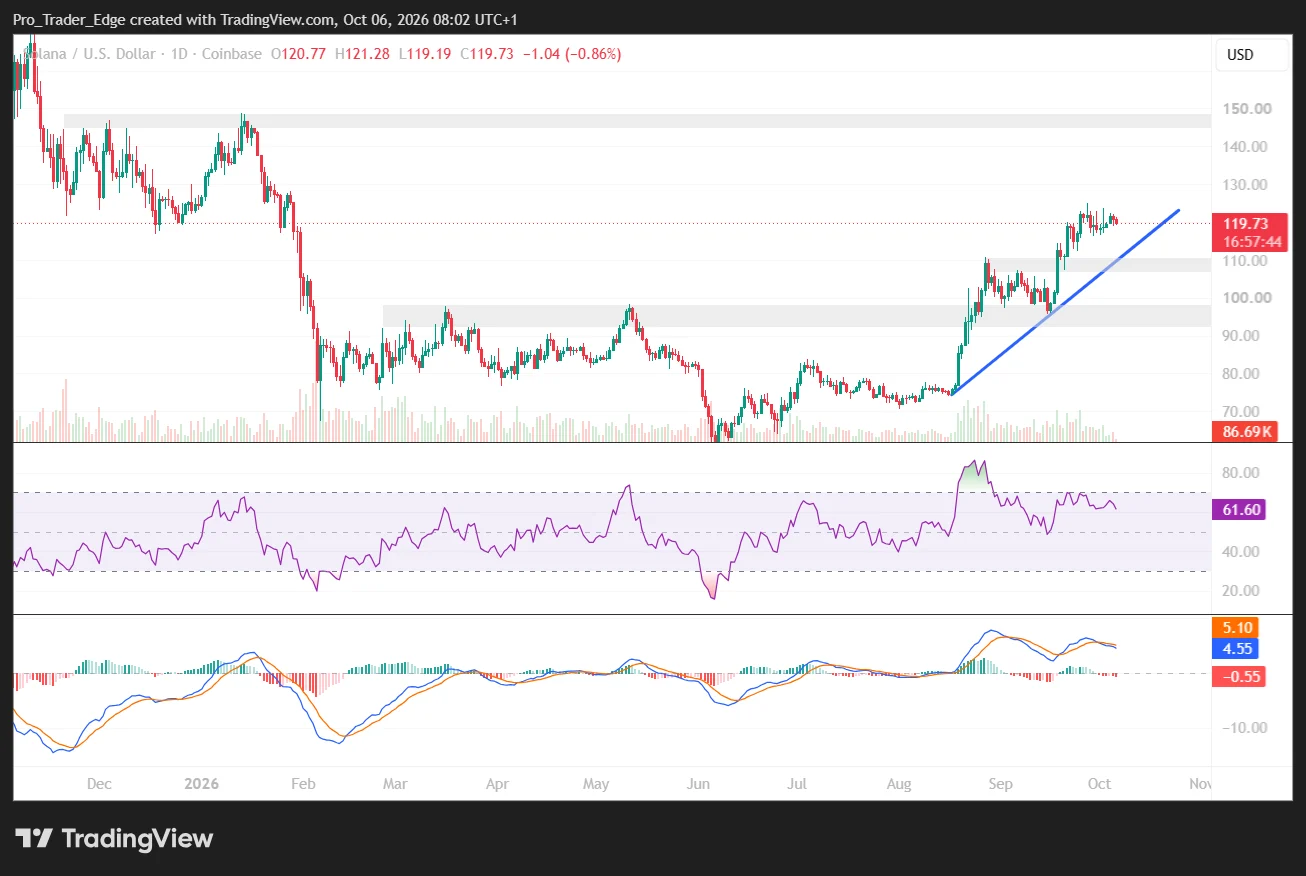
From a technical perspective, SOL encounters selling pressure around the $120 threshold. The Relative Strength Index registers at 64.
Should the price successfully breach $125, market participants are monitoring a potential advance toward $150. Conversely, a decline into the $110–$115 range remains under consideration among traders if bullish momentum proves insufficient to overcome current resistance.
Get 3 Free Stock Ebooks
Discover top-performing stocks in AI, Crypto, and Technology with expert analysis.
- Top 10 AI Stocks - Leading AI companies
- Top 10 Crypto Stocks - Blockchain leaders
- Top 10 Tech Stocks - Tech giants



