


Key Highlights
- BTC surged past $80,000 mark, achieving this level for the first time since May 15, 2026
- The leading cryptocurrency has rallied 38% from its $58,000 lows recorded in late June and early July
- Weekly inflows into U.S. spot Bitcoin ETFs reached $1.9 billion, marking the highest level since October 2025
- Declining Treasury yields combined with U.S. Treasury buyback strategy supported the rally
- Short position liquidations exceeded $220 million within a 24-hour window as BTC breached $80K
The world’s largest cryptocurrency pushed beyond the $80,000 threshold on Monday, marking its first appearance at this level since mid-May and continuing a robust recovery trend that has accelerated in recent sessions.
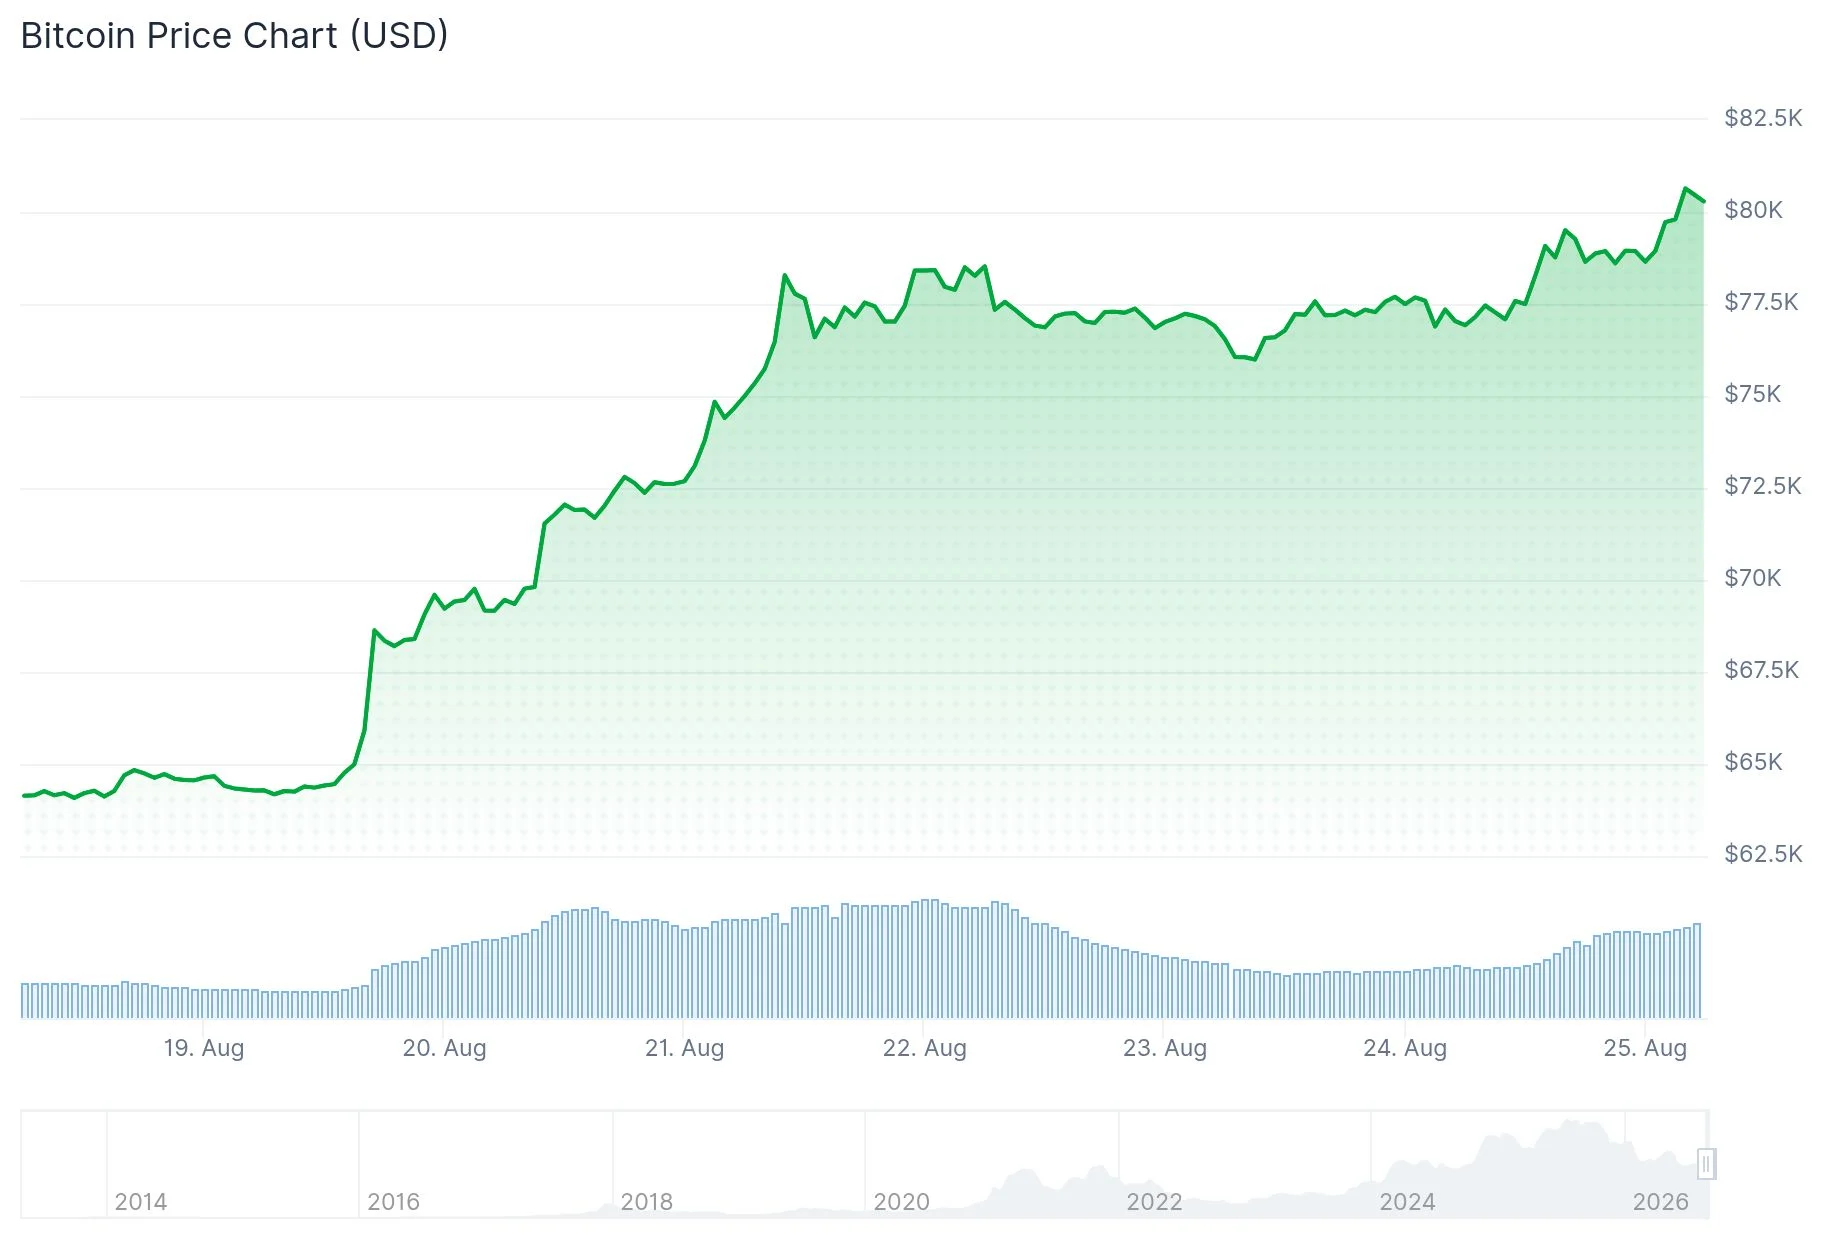
The breakthrough occurred as U.S. markets opened for trading, with the BTC/USD pair advancing approximately 3% intraday before experiencing a modest retracement following European market closure.
Compared to the late-June and early-July troughs when Bitcoin momentarily traded under $58,000, the digital asset has now appreciated approximately 38%.
Changes in U.S. Treasury strategy have contributed to the upward momentum. Treasury officials announced a doubling of their planned repurchases of longer-maturity government securities extending through early November, with these acquisitions being financed through short-duration debt instruments. Additionally, on Monday the Treasury indicated potential utilization of its approximately $1 trillion General Account to support these buyback operations.
Declining yields on Treasury securities provided widespread support to risk-oriented assets, crypto included, following an extended period of restrictive financial market conditions.

Institutional Investment Flows Accelerate
U.S.-listed spot Bitcoin exchange-traded funds accumulated approximately $1.9 billion in net inflows throughout the previous week. This figure represents the most substantial weekly accumulation since October 2025, signaling rekindled appetite from institutional and traditional market participants.
The breach of the $80,000 psychological barrier also catalyzed a significant wave of forced liquidations on short positions. According to CoinGlass data, cryptocurrency short liquidations surpassed $220 million during the 24-hour period surrounding the price movement. Market observers have identified a concentration of buy-side liquidity positioned near $76,700, which technical analysts view as a potential support zone should prices experience a pullback.
For the month of August, Bitcoin has posted gains of 25% month-to-date, representing its strongest August showing since 2017.
Technical Indicators Point to Potential Trend Reversal
Market analyst Ali Charts shared on X that Bitcoin has successfully recaptured its 1,130-day simple moving average. Ali Charts highlighted that this technical level has historically signaled the conclusion of bear market phases throughout four distinct market cycles. Bitcoin fell below this moving average on June 1, 2026, spending 80 consecutive days underneath before recovering it on August 20 following a break above $74,000. Ali Charts suggested that if historical patterns hold, the market may have already established its cycle bottom.
Market analyst Rekt Capital highlighted that Bitcoin registered its first weekly close above the 50-week exponential moving average—presently situated at $77,251—since November 2025.
“Should this represent a Bear Market Relief Rally, Bitcoin might experience a pullback as soon as this week, or potentially within the coming weeks,” Rekt Capital stated. “The critical question now is whether Bitcoin can demonstrate sustained strength.”
Historical context from Bitcoin’s 2022 bear market reveals that BTC recorded two weekly closes above the 50-week EMA before ultimately declining to cycle bottoms.
Market participants are now closely monitoring the Federal Reserve’s primary inflation metric, the PCE index, scheduled for release this week.
Get 3 Free Stock Ebooks
Discover top-performing stocks in AI, Crypto, and Technology with expert analysis.
- Top 10 AI Stocks - Leading AI companies
- Top 10 Crypto Stocks - Blockchain leaders
- Top 10 Tech Stocks - Tech giants



