



Key Takeaways
- BTC plummeted from $79,500 to sub-$76,000 levels, resulting in approximately $547 million in total liquidations
- Leveraged long traders suffered the most damage, with forced closures exceeding $659 million within a single 24-hour period
- Spot Bitcoin ETFs in the United States recorded $307.45 million in net inflows on August 21, marking a consecutive five-day positive streak
- Technical analysts project potential decline targets ranging from $71,000 down to $68,000 should bearish momentum persist
- Critical macroeconomic catalysts including PCE inflation data, Nvidia’s quarterly report, and Jackson Hole symposium may dictate Bitcoin’s trajectory
Bitcoin experienced a dramatic reversal from approximately $79,500 — representing its strongest price point in several months — plunging beneath the $76,000 threshold in an aggressive downturn that blindsided overleveraged market participants. The sudden correction eliminated roughly $547 million worth of crypto positions before stabilization occurred.
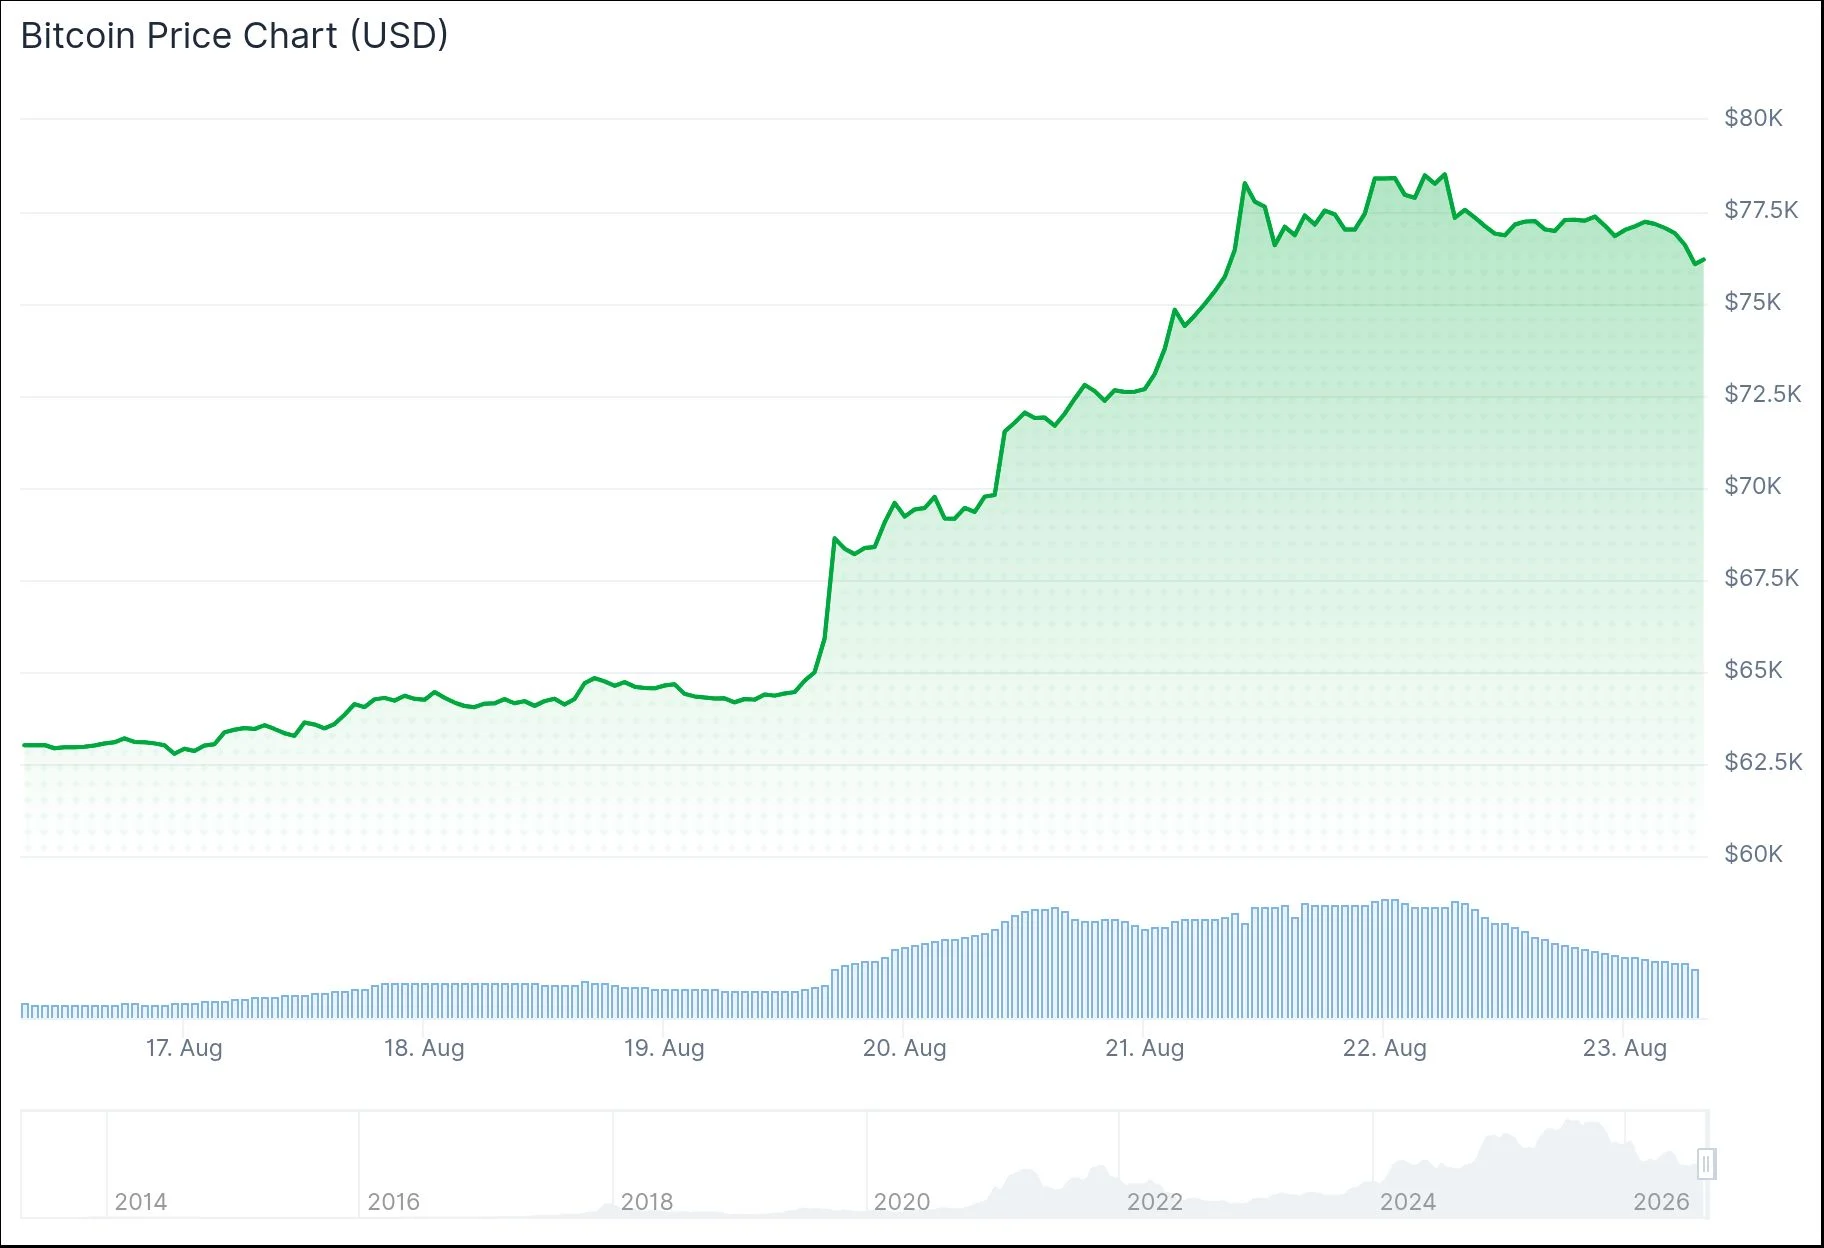
Currently, BTC is exchanging hands near $77,291, reflecting a 0.43% decline.
The violent price action revealed underlying market vulnerability. Bullish positions absorbed the overwhelming majority of damage, representing approximately $659 million in liquidations versus merely $148 million from short positions — an imbalanced ratio exceeding four to one.
Trading venues such as Hyperliquid witnessed individual long position liquidations spanning from $23 million up to $48 million, demonstrating the extreme concentration of risk among certain market participants.
Blockchain analyst Maartunn identified excessive bullish positioning as the primary catalyst. When Bitcoin penetrated critical liquidation thresholds, cascading forced selling intensified the downturn. Maartunn observed that liquidity concentration is now forming above $78,300, alongside additional clusters positioned lower around $68,000.

Technical Perspectives From Market Observers
Market analyst P4 Provider identified $79,000 as a crucial resistance threshold following Bitcoin’s liquidity sweep beyond that zone. P4 Provider additionally highlighted bearish RSI divergence, increasing USDT dominance, and elevated funding rates as concerning indicators. Projected downside objectives span from $77,000 to $71,000, with $70,000 representing a more severe support level should selling intensity escalate.
Cryptocurrency analyst Daan Crypto Trades (@DaanCrypto) observed via social media that the present weekly BTC candlestick ranks within the top 5% of largest candles recorded throughout the previous eight years. He highlighted that the monthly candle appears less stretched, positioned in the 32nd percentile. Daan mentioned that during 61% of bullish monthly periods, the ultimate high materializes later than the current timeframe — implying the existing peak might still be surpassed, though he emphasized no certainties exist.
Such behavior follows historical precedent. Previously in May, Bitcoin’s descent below $75,000 generated approximately $923 million in aggregate liquidations, with bullish positions comprising over 90% of elimination volume.
Upcoming Economic Catalysts
Notwithstanding the correction, demand indicators persist. United States spot Bitcoin ETFs registered $307.45 million in net capital inflows on August 21, continuing a five-consecutive-day positive trend.
Scheduled for August 26, the U.S. Bureau of Economic Analysis will publish second-quarter GDP figures alongside July PCE inflation measurements. Nvidia’s quarterly earnings announcement also occurs that date. Federal Reserve Chair Kevin Warsh delivers remarks at Jackson Hole on August 28.
Maintaining support above $77,000 represents the critical near-term objective for Bitcoin bulls.
Get 3 Free Stock Ebooks
Discover top-performing stocks in AI, Crypto, and Technology with expert analysis.
- Top 10 AI Stocks - Leading AI companies
- Top 10 Crypto Stocks - Blockchain leaders
- Top 10 Tech Stocks - Tech giants



