


Key Highlights
- Standard Chartered issued a $200 long-term price projection for LINK, targeting $13 by late 2026
- Large-value transactions exceeding $100K reached 246 in one day, marking a five-month peak
- Major holders controlling 100K–10M LINK now possess 46.57% of total circulating tokens
- The MVRV ratio crossed above its 200-day SMA in a golden cross formation, the first such occurrence in over 12 months
- Despite a 6.8% gain since Monday, LINK remains over 28% below its year-start value
On Monday, Standard Chartered began formal coverage of Chainlink (LINK), establishing a long-term price objective of $200 by the end of this decade. The banking institution’s roadmap anticipates LINK hitting $13 by late 2026, advancing to $82 in 2028, and reaching $133 by 2029.
The projection emphasized Chainlink’s strategic positioning within asset tokenization and decentralized finance (DeFi) ecosystems as primary catalysts for expansion.
Following the bank’s announcement, activity among major token holders intensified dramatically. Data from blockchain intelligence platform Santiment captured 246 individual transfers exceeding $100,000 within a 24-hour period — representing the strongest single-day performance observed in the past five months.
Address clusters containing between 100,000 and 10 million LINK tokens currently possess 466.31 million coins, representing 46.57% of available supply. According to Santiment’s analysis, this segment has experienced simultaneous growth in both holdings and transaction frequency.

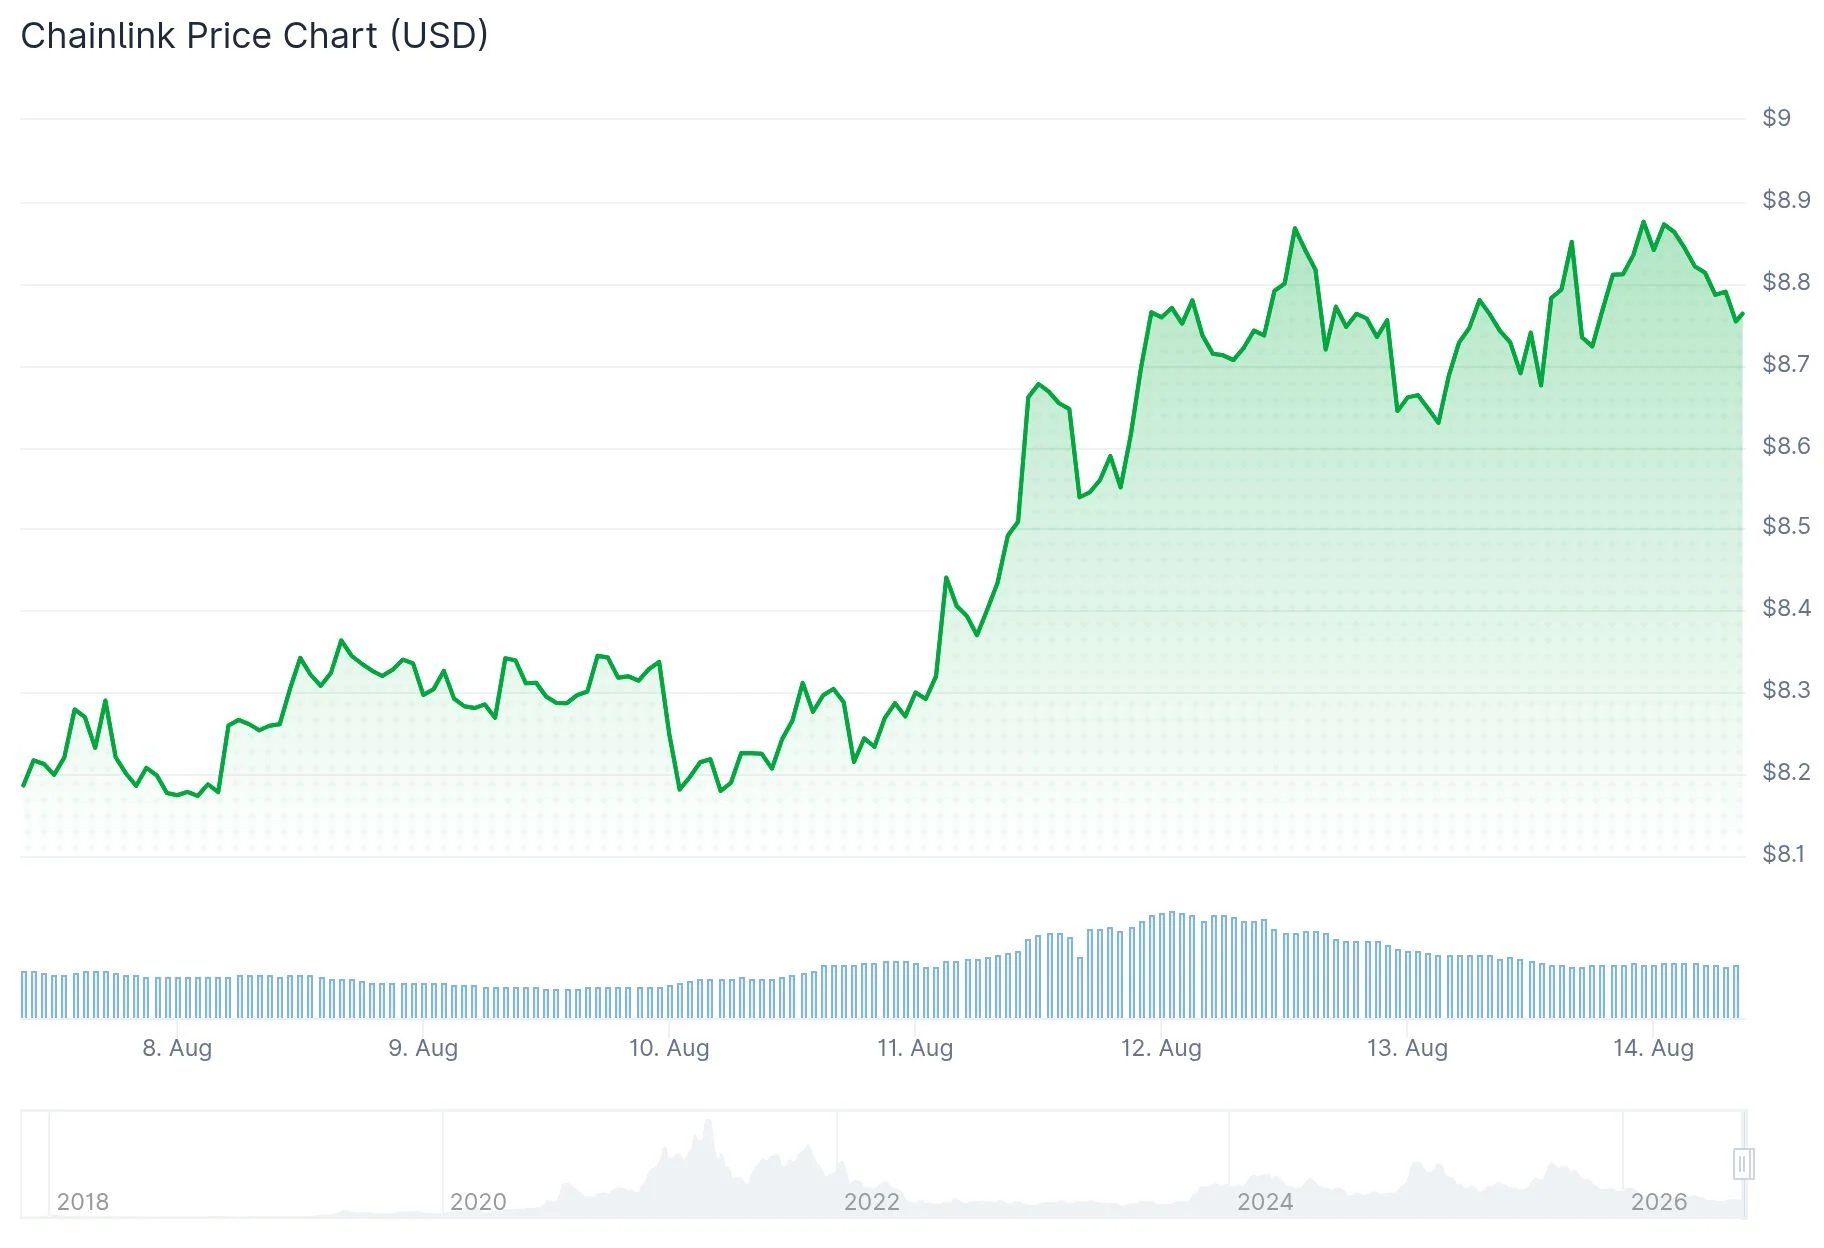
Crypto analyst Ali Charts observed that transfers exceeding $1 million increased from approximately 1 to around 15 during a 96-hour window. At that juncture, LINK was exchanging hands near $8.70, with $9 representing a critical resistance threshold.
Positive Technical Formations Emerge
Multiple technical metrics are now aligning favorably for LINK.
The Market Value to Realized Value (MVRV) ratio has executed a golden cross configuration, moving above its 200-day simple moving average for the first occurrence in more than twelve months. Ali Charts highlighted that comparable historical patterns preceded a 155% upward movement in November 2024 and an 85% advance in July 2025.
Additionally, the monthly TD Sequential indicator has generated a buy signal. Given its monthly timeframe positioning, market observers regard this as carrying more weight than shorter-duration signals.
A sustained breach and daily settlement above $9 could establish momentum toward $10, with potential extension to $11.30 — representing approximately 30% upside from present trading levels. Critical support zones are positioned at $8.30 and subsequently at $8.00.
ETF Activity and Exchange Holdings Present Mixed Signals
Spot LINK exchange-traded funds captured merely $150,307 in the previous week, recording zero net inflows during two of the preceding three weeks. Total cumulative net inflows measure $128.29 million compared to $114.87 million in aggregate net assets.
Information from CryptoQuant reveals that exchange-held reserves decreased from 142.8 million LINK tokens in late June to approximately 122.3 million in early August, though quantities have subsequently increased to 123.7 million — a fluctuation pattern that may indicate distribution during price rallies.
LINK continues to trade more than 28% below its year-to-date opening levels. The 6.8% advance following Monday’s bank forecast has not offset year-long losses.
Total accumulated spot LINK ETF net inflows presently register at $128.29 million.
Get 3 Free Stock Ebooks
Discover top-performing stocks in AI, Crypto, and Technology with expert analysis.
- Top 10 AI Stocks - Leading AI companies
- Top 10 Crypto Stocks - Blockchain leaders
- Top 10 Tech Stocks - Tech giants



