
 Price Alert: Crypto Analyst Flags Risk of Retesting Recent Lows")
Key Takeaways
- Ethereum declined 4% over 24 hours, settling near $1,628
- The $1,700 level has transitioned from a support floor to a resistance ceiling following February 2026 lows
- Crypto markets witnessed $1.1 billion in liquidations within a single trading day
- Bitcoin ETFs experienced $91.37M in outflows while Ethereum ETFs attracted $82.37M in inflows
- Breaking below $1,600 support may trigger a descent toward the $1,500 zone
Ethereum is currently hovering near $1,628 following a sharp 4% decline over the past day. This downturn occurred alongside a broader cryptocurrency market correction of 3.46%, pushing the total digital asset market capitalization down to $2.12 trillion.
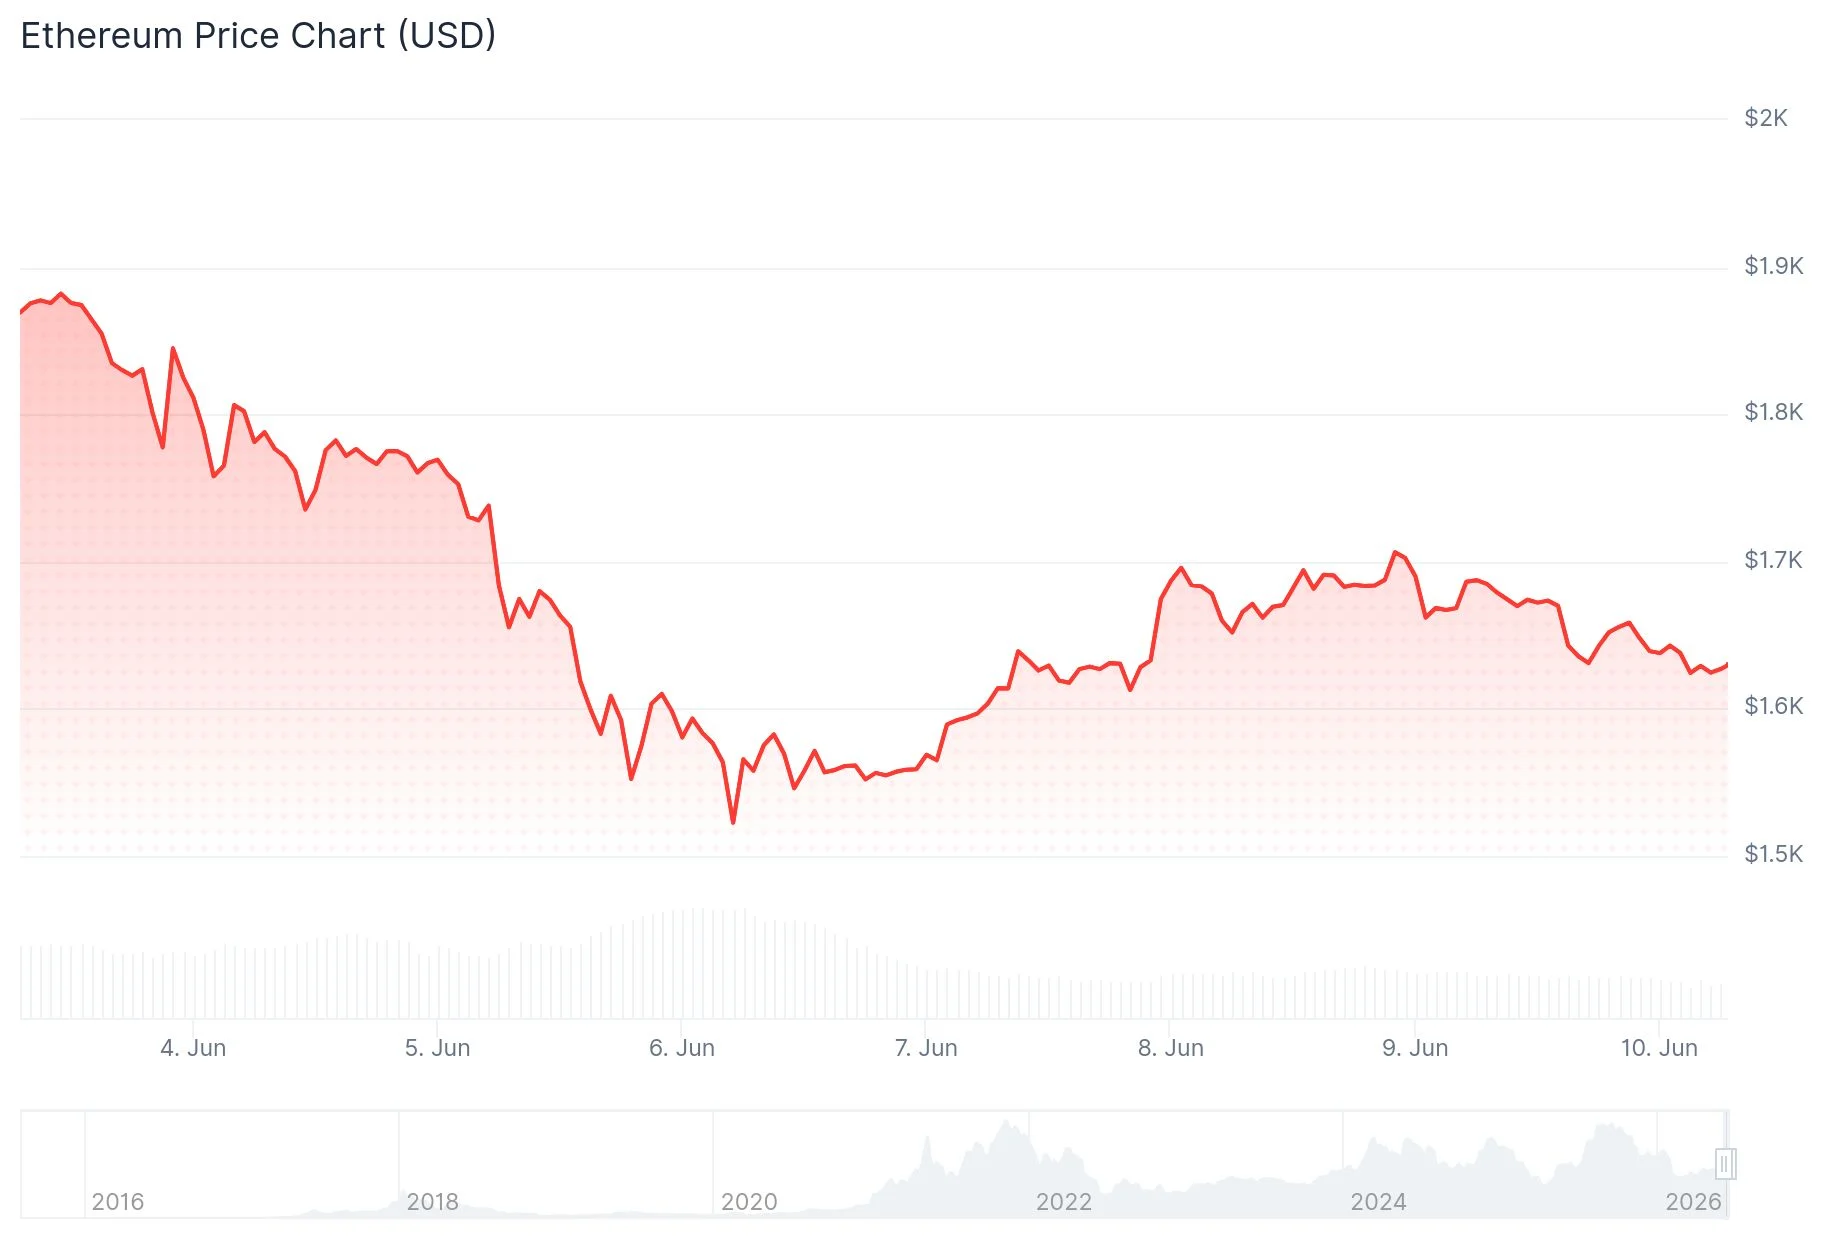
Bitcoin similarly suffered losses, retreating from $64,100 to approximately $61,049. This widespread selloff resulted in more than $1.1 billion worth of liquidated positions throughout the cryptocurrency ecosystem within just 24 hours.
Market analyst Ted (@TedPillows) highlighted that the $1,700 price level has now become a crucial resistance barrier for ETH. This zone previously served as Ethereum’s February 2026 bottom, but has now reversed its role with sellers aggressively defending this threshold.
In a post on X, Ted cautioned: “$ETH is trying to reclaim the $1,700 level. This is the zone where Ethereum bottomed in Feb 2026 and is now acting as resistance. If ETH fails to reclaim this, a sweep of lows could happen next.” According to his technical analysis, $1,540 represents a plausible downside objective.
The selling wave extended across multiple cryptocurrencies. XRP tumbled beneath $1.15, demonstrating that the bearish pressure wasn’t confined to just ETH or BTC. Market participants attributed the weakness to deteriorating risk appetite and the forced unwinding of highly leveraged trading positions.

Liquidation Metrics Signal Continued Market Turbulence
Crypto analyst CryptoReviewing highlighted a notable asymmetry in the 24-hour liquidation heatmap: $331 million in liquidated long positions compared to a massive $1.84 billion in short positions. This 5.5x disparity suggests the potential for violent price swings should the market experience a sudden reversal.
According to SoSoValue data, Bitcoin ETFs registered $91.37 million in net outflows on June 8. In contrast, Ethereum ETFs documented $82.37 million in net inflows during the same trading session, as reported by Wu Blockchain on X.
Analyzing the 4-hour timeframe, Ethereum was changing hands at $1,644 at press time. The Relative Strength Index registers around 43.21, indicating subdued momentum. Meanwhile, the Chaikin Money Flow indicator hovers near 0.05, suggesting modest buying activity but lacking substantial conviction.
Critical Price Thresholds for ETH Traders
The immediate resistance target stands at $1,700. Successfully breaking through this barrier would pave the way toward $1,800, which market observers believe could restore positive sentiment.
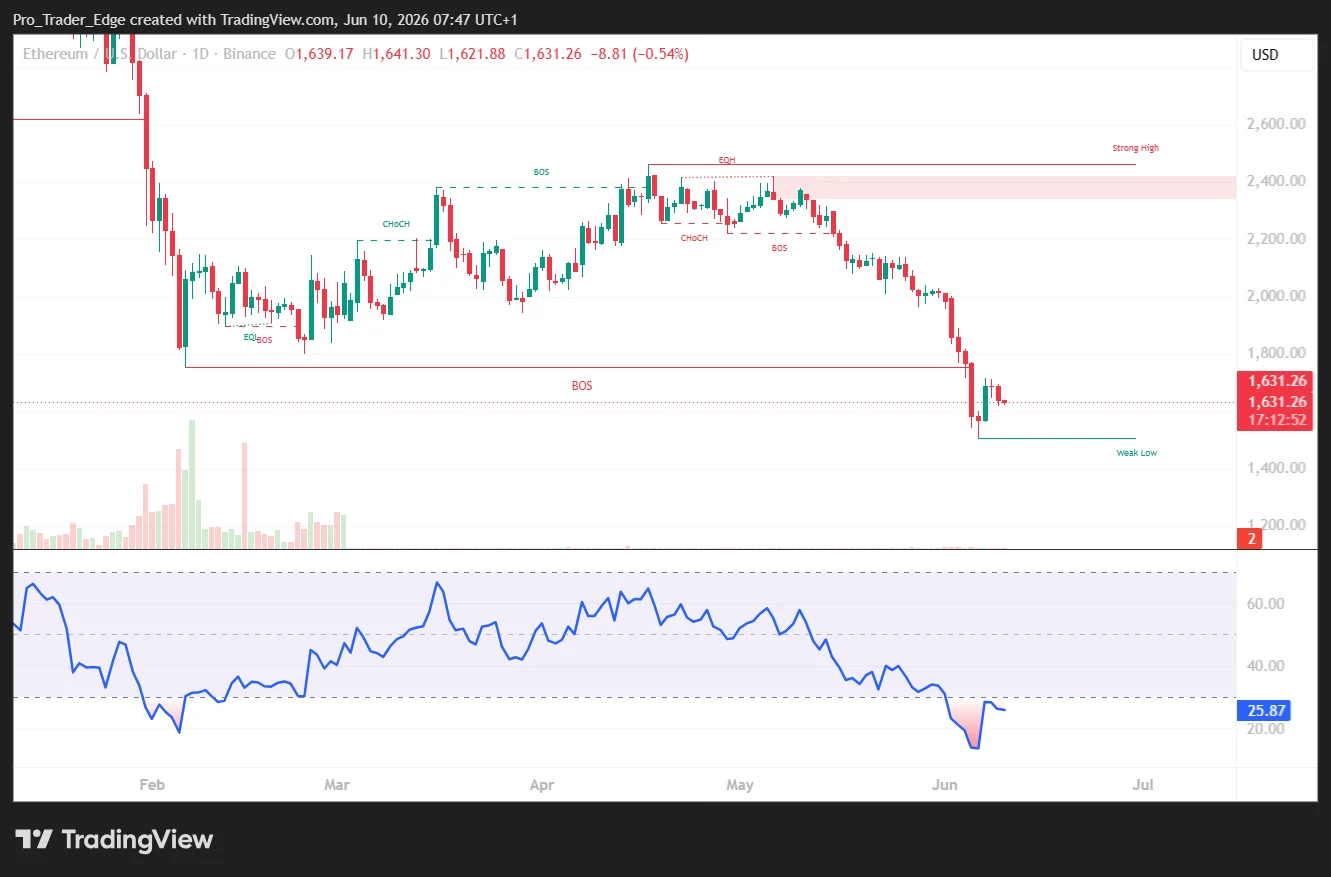
Should Ethereum manage to climb above $1,800, the psychological $2,000 level would emerge as the subsequent resistance challenge.
Conversely, $1,600 represents the critical support threshold requiring close attention. If ETH breaks down through this level, a retest of the $1,500 zone becomes increasingly probable.
As of this analysis, ETH was maintaining a position marginally above $1,600, though momentum indicators continue to display bearish characteristics.
Get 3 Free Stock Ebooks
Discover top-performing stocks in AI, Crypto, and Technology with expert analysis.
- Top 10 AI Stocks - Leading AI companies
- Top 10 Crypto Stocks - Blockchain leaders
- Top 10 Tech Stocks - Tech giants


