
 Attracts Heavy Institutional Interest as Price Eyes Breakout Above $87")
Key Takeaways
- Solana maintains support at $85.95, positioned just above its 20-day EMA of $85.31, while facing resistance at the 50-day EMA of $87.08 that has rejected price action since March.
- A significant descending trendline has been broken on the daily timeframe, with SOL currently retesting this level as potential support in what could signal a trend reversal.
- Weekly timeframe analysis identifies $120–$125 as the next significant resistance zone if Solana successfully clears its current downtrend.
- Real-world asset tokenization on Solana exploded from $170M to $2B over the past year, supported by 80–100M active wallets and $17B in stablecoin liquidity.
- Cumulative spot ETF inflows for SOL have surpassed $1B milestone, with net assets currently standing at $887.92M.
As of April 23, Solana is changing hands at $85.95, reflecting a 1.10% decline over the past 24 hours. The asset continues to find support above its 20-day exponential moving average positioned at $85.31, a level that has provided a floor for price action throughout the previous week.
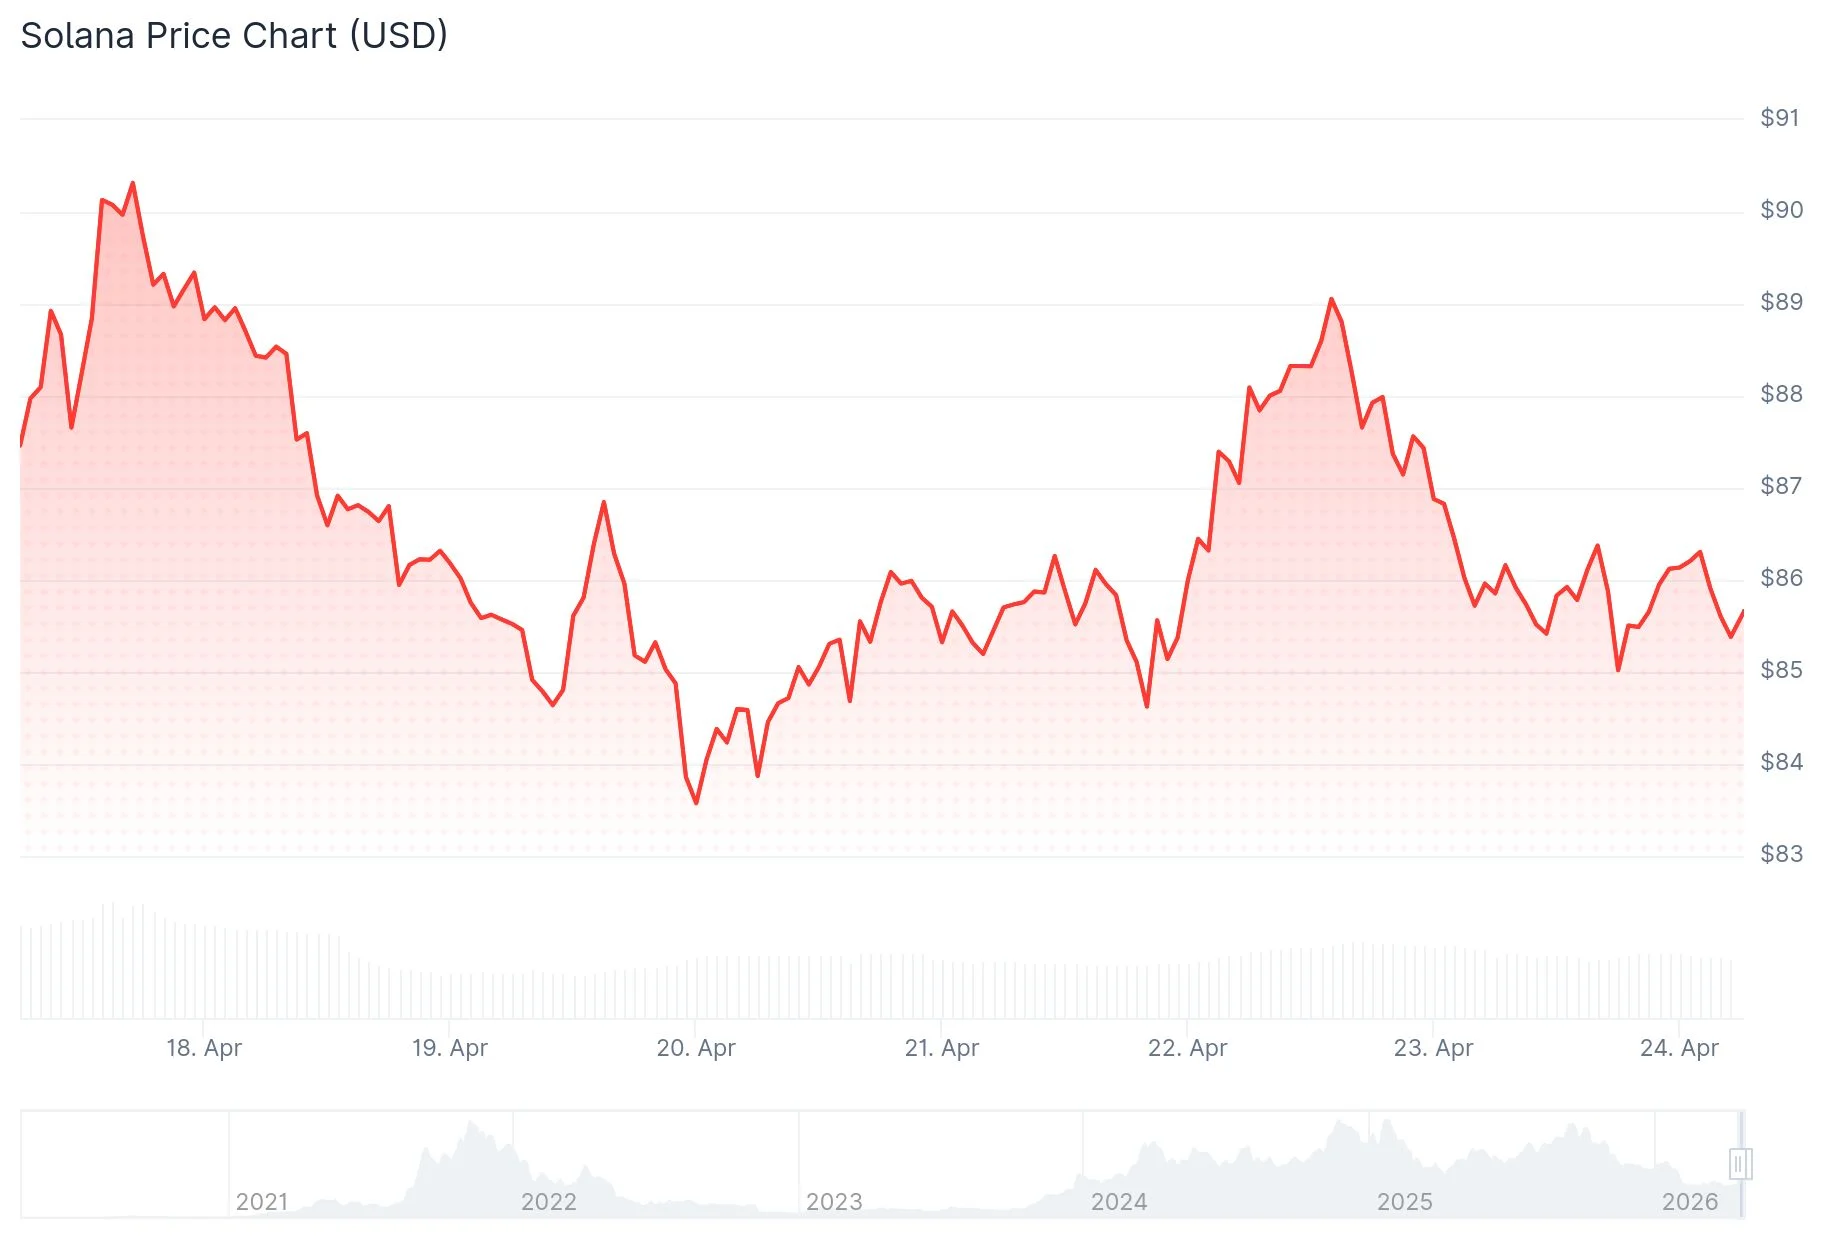
The critical obstacle remains the 50-day EMA located at $87.08. Since March, virtually every attempt to establish a daily close above this threshold has been turned back. The upper boundary of the Bollinger Bands rests at $89.43, while the 100-day EMA extends further to $96.63.
On the support side, a daily close beneath the 20-day EMA would activate the middle Bollinger Band at $84.63 as the next target. Further deterioration would expose the lower Bollinger Band at $79.84, with February’s low around $67 representing a worst-case scenario.
Analyzing the daily chart reveals that SOL has successfully penetrated a descending trendline that had capped upside momentum from late 2025 through early 2026. Technical commentary shared by CryptoCurb on X highlights that this breakout materialized after multiple rejected attempts, including during the Binance flash crash event and heightened tensions surrounding Iran war concerns.
[[EMBED_0]]

The current price action shows SOL hovering near the breakout area without surrendering gains back below the trendline. This represents a meaningful structural shift. However, this bullish setup requires validation through sustained buying pressure that transforms the broken trendline into reliable support.
Institutional Capital Flows Accelerate
Solana ecosystem executive Nick Ducoff revealed that real-world asset tokenization on the network experienced explosive growth from $170M to $2B within a single 12-month period — representing approximately 12x expansion. Institutional participants have identified three primary catalysts: proven network stability, 80 to 100 million active wallets providing distribution infrastructure, and $17B worth of stablecoins already deployed on-chain.
[[EMBED_1]]
Cumulative inflows into SOL spot exchange-traded funds have eclipsed the $1B threshold for the first time. Current total net assets measure $887.92M, equivalent to 1.77% of Solana’s overall market capitalization. The previous week recorded $35.17M in ETF inflows. While April 22 showed zero daily movement, the three preceding trading sessions collectively contributed $31.32M.
Weekly Chart Suggests $120–$125 Zone
Examining the weekly timeframe, technical analysis from Rendoshi AI on X demonstrates SOL challenging a falling trendline after defending support in the $75–$80 range. The Relative Strength Index has rebounded from near-oversold territory, indicating strengthening momentum, though this alone doesn’t constitute breakout confirmation.
Should SOL successfully break through and maintain position above the weekly downtrend line, the subsequent major resistance zone extends from $120 to $125. Failure to sustain elevation would leave SOL oscillating above the $75–$80 support band without establishing a definitive recovery trajectory.
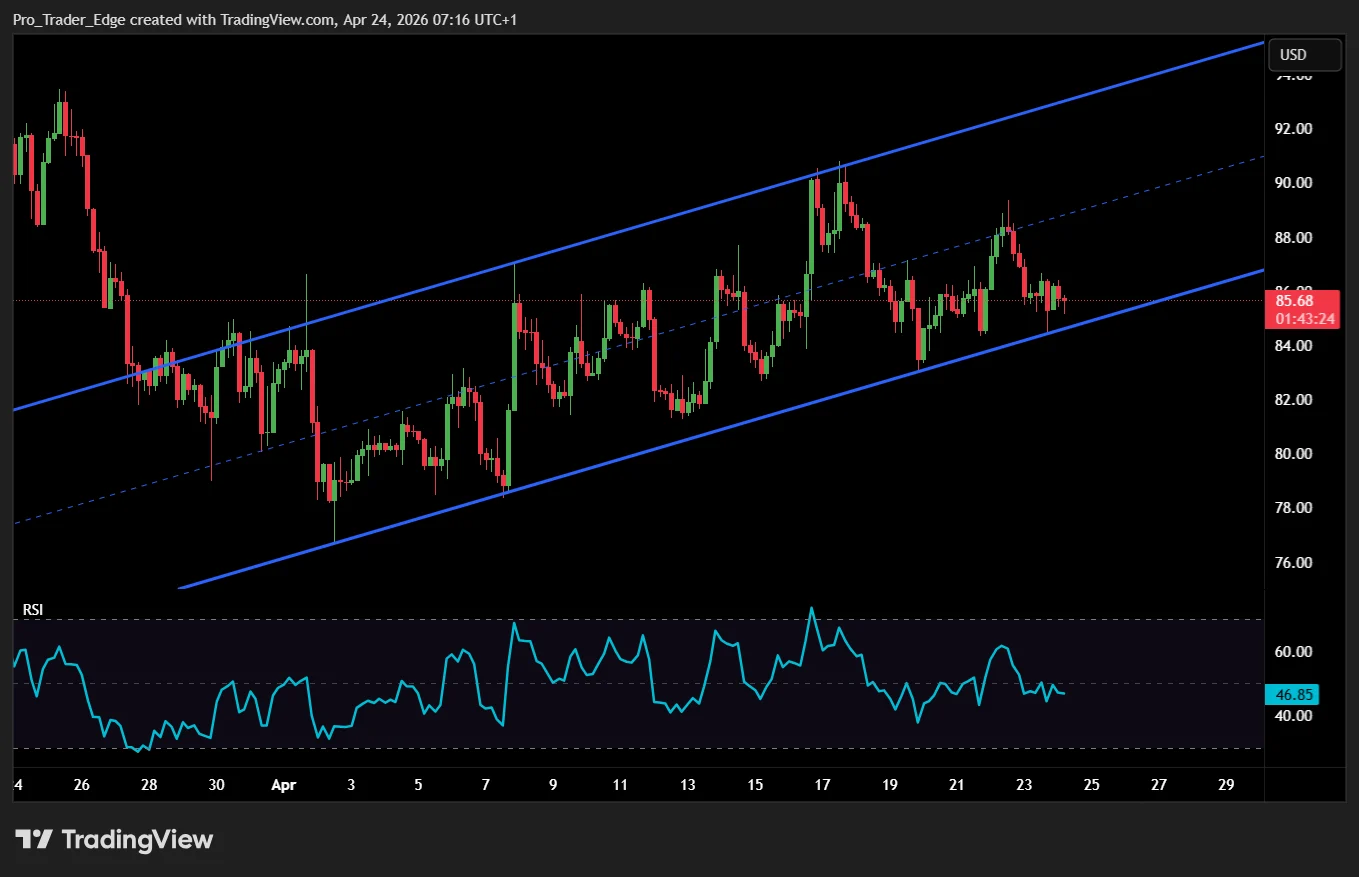
Zooming into the 2-hour chart, Solana is navigating within an ascending channel structure that originated from the April 2 low near $78. The RSI generated a fresh bullish signal at the recent low around $83 — mirroring the same pattern that triggered previous rebounds. The MACD indicator remains in negative territory at -0.25, signaling that momentum hasn’t yet validated the RSI signal.
The lower boundary of the 2-hour ascending channel at $83–$84 coincides with the daily 20-day EMA, establishing this zone as the most critical support region to monitor heading into April 24.
Get 3 Free Stock Ebooks
Discover top-performing stocks in AI, Crypto, and Technology with expert analysis.
- Top 10 AI Stocks - Leading AI companies
- Top 10 Crypto Stocks - Blockchain leaders
- Top 10 Tech Stocks - Tech giants


