
 Returns to $90 Resistance Zone — Can Bulls Finally Break Through?")
Key Takeaways
- SOL currently hovers near $88–$90, a critical resistance barrier that has consistently pushed prices lower since February.
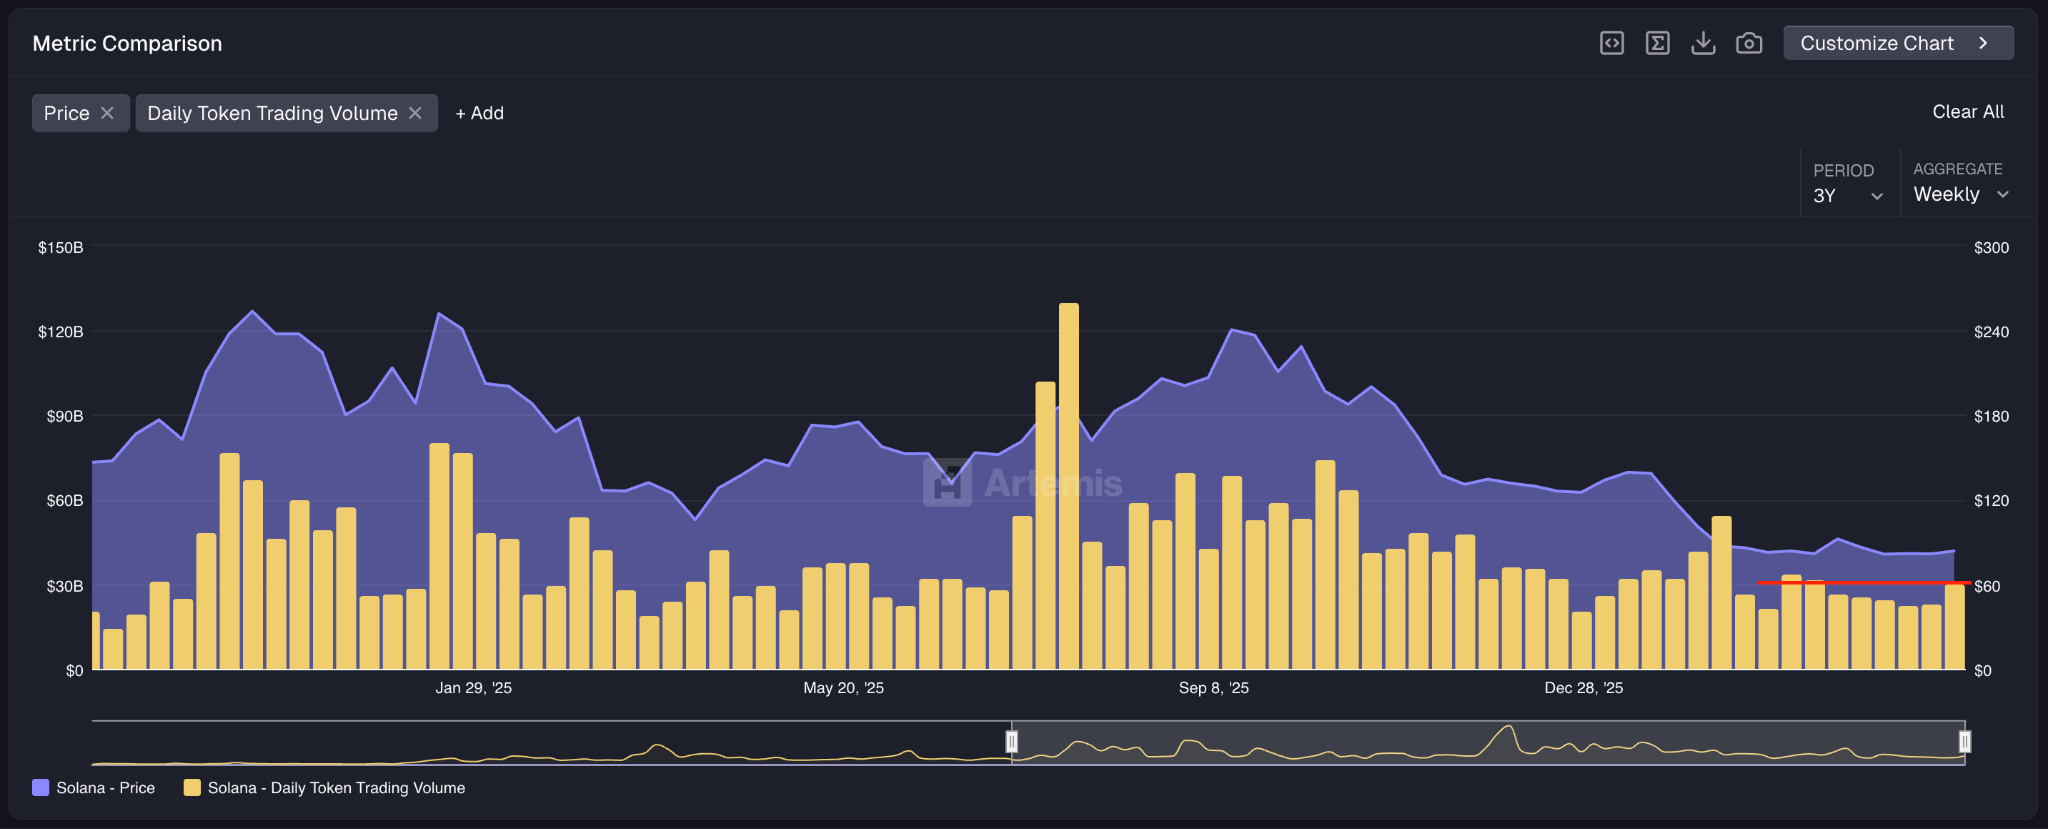
- Daily trading activity surged 35% to reach $5.3 billion, marking the strongest weekly volume performance since the beginning of March.
- Institutional interest remains evident with Solana ETFs seeing continuous inflows over 8 consecutive trading sessions, accumulating $50 million and pushing AUM to $863 million.
- A sustained close beyond $95–$98 could trigger a rally toward $105–$120; rejection may send SOL retreating to the $75–$77 zone.
- The network’s DeFi presence lags significantly, with top protocol Kamino holding less than $2 billion TVL versus Ethereum’s Aave commanding $12.8 billion.
Solana (SOL) has returned to challenge the $90 resistance barrier, a critical threshold that has consistently rejected bullish attempts throughout February and beyond. Currently trading near $88, the token shows a modest 2.5% gain over the past day, following an earlier peak at $94.21 during this cycle before retracing more than 5%.
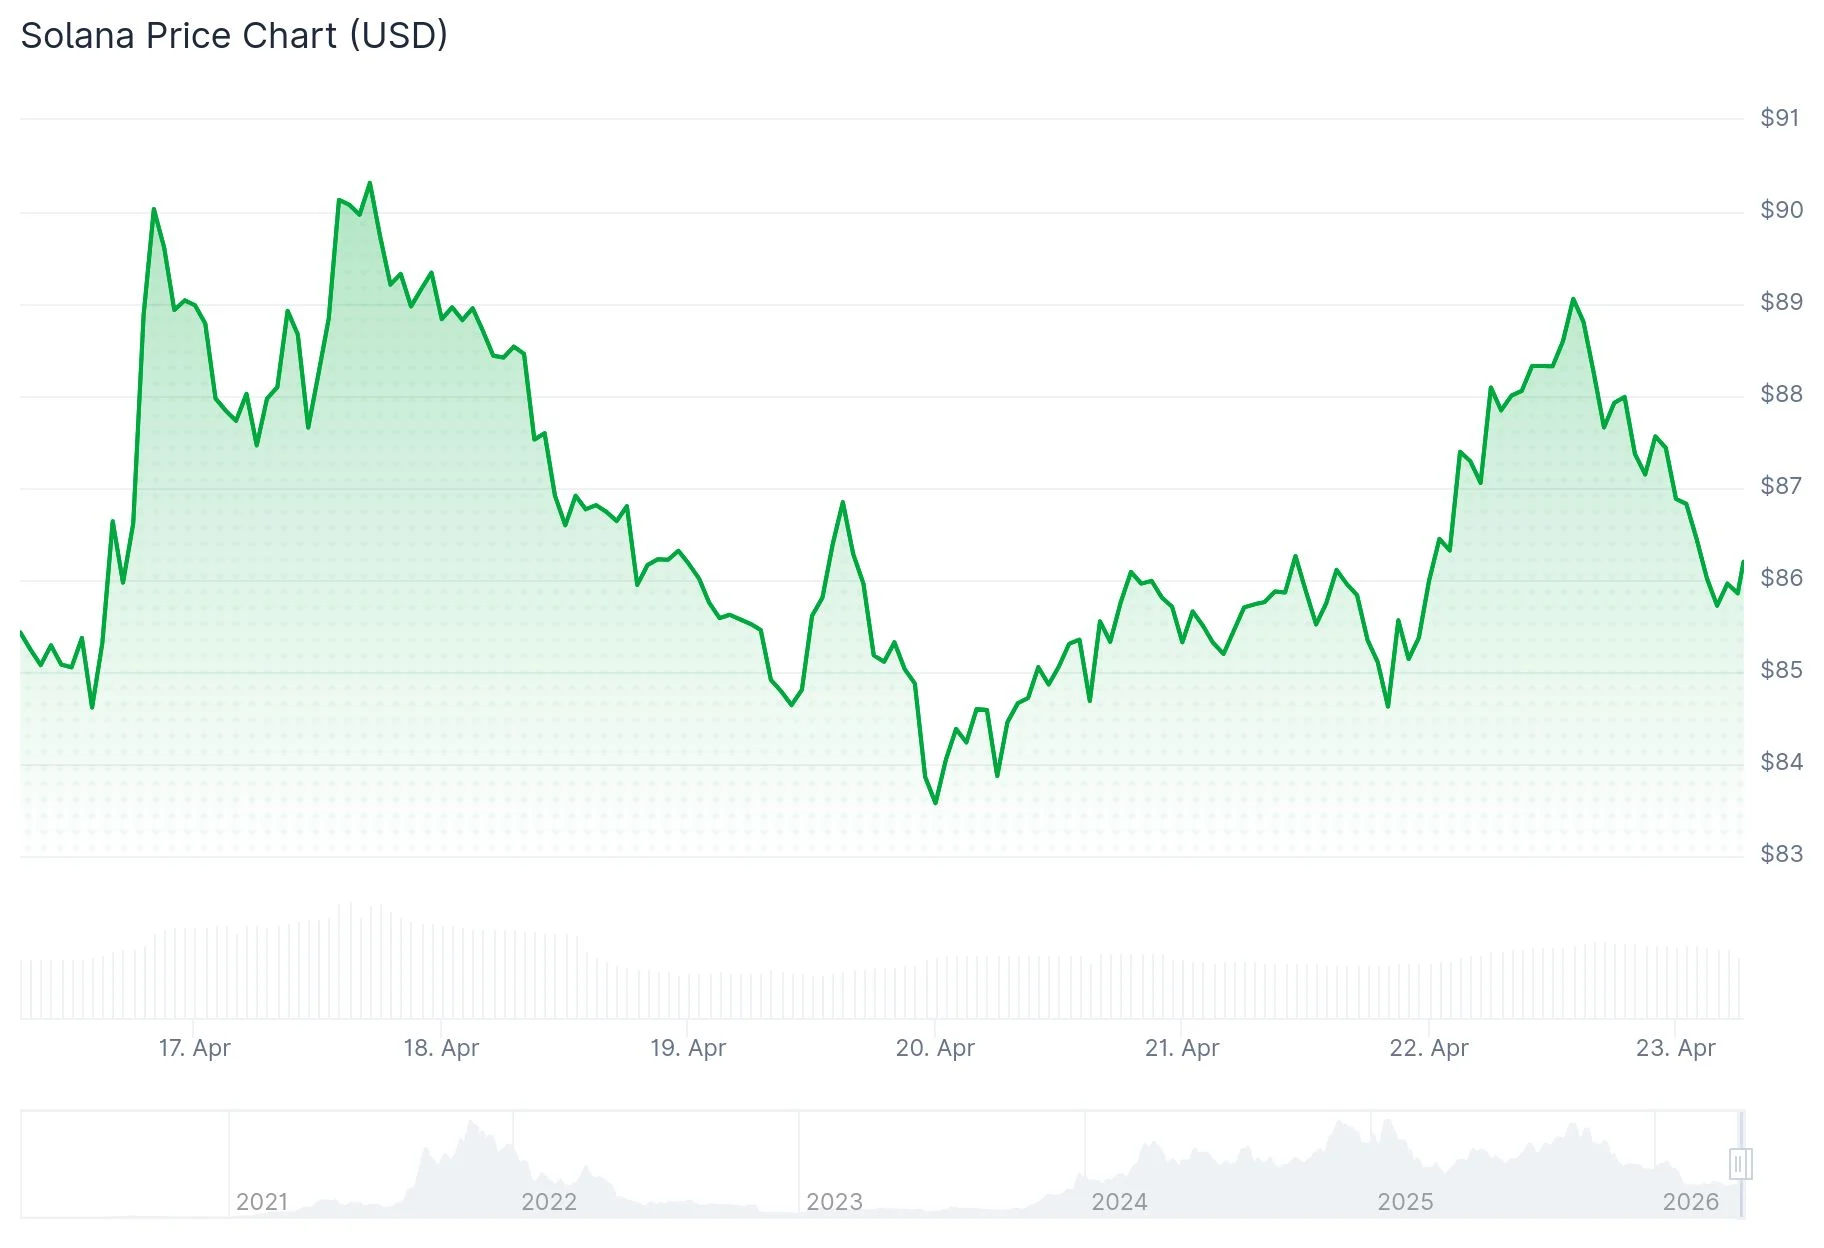
Over the trailing 30-day period, SOL has declined approximately 2.4% while both Bitcoin and Ethereum posted gains near 12%. This performance divergence has captured the attention of market participants and technical analysts evaluating whether this latest test at resistance will yield different results.
Market activity has intensified considerably. Daily trading volume expanded by 35% to hit $5.3 billion, representing nearly 11% of SOL’s circulating supply valuation. Data from Artemis indicates that the previous week recorded the most robust volume levels observed since early March.
The $88–$90 supply zone has proven formidable, with multiple rejection episodes documented. Each bullish push into this range has met with substantial selling pressure. Market analysts have identified resistance clusters spanning $86 to $89, noting that a legitimate breakout would require a daily candle close exceeding $95–$98 accompanied by elevated volume.
On a constructive note, Solana exchange-traded funds have maintained positive net flows for eight straight sessions. Combined inflows throughout this period totaled $50 million, elevating aggregate fund holdings to $863 million. This persistent institutional-level accumulation suggests underlying demand for SOL exposure remains intact.

Chart Analysis and Technical Indicators
Market analyst Lucky shared observations on X, highlighting charts depicting SOL consolidating within a descending channel formation while testing overhead resistance. The analysis also identifies a demand zone anchored at $67.73. Lucky referenced a prior breakout from comparable structure that generated substantial upward movement, suggesting a similar pattern may be developing at a larger timeframe scale.
Contrasting this view, analyst MCO Global DE maintains that the current rebound appears corrective in nature, with the five-wave decline pattern still valid beneath $89. Two divergent interpretations examining the same price behavior.
The Relative Strength Index has climbed toward the mid-50 range — indicating strengthening momentum without reaching overbought territory. The MACD indicator has also turned positive, signaling a gradual transition toward buying dominance. Traders Union projects a price target near $87.84 for the coming week, suggesting expectations for ongoing consolidation rather than immediate breakout.
Should SOL successfully breach and maintain levels above $95–$98, technical analysts identify initial upside objectives in the $105–$120 range. One assessment calculates potential gains of 36% from present levels if momentum carries price toward the 200-day exponential moving average. Extended targets reaching $253 have been identified on longer-term breakout projections assuming favorable broader market conditions.
Critical support is established at $82–$83, with additional support layers at $80.50 and $77.20. The demand zone foundation at $67.73 represents the critical floor that bulls must defend.
DeFi Ecosystem Comparison
One element creating headwinds for Solana relative to Ethereum involves its decentralized finance infrastructure. Kamino, currently the largest DeFi application on Solana, maintains total value locked below $2 billion. By comparison, Ethereum’s Aave protocol alone commands $12.8 billion. Additionally, Solana operates with 777 active validator nodes while Ethereum’s network supports 912,000 validators.
The meme token sector, where Solana-based platforms such as Pump.fun have achieved market leadership, has also experienced cooling activity throughout the past six months.
Recovery in open interest approaching $6 billion alongside strengthening stablecoin network volume constitute the primary confirmation signals market participants are monitoring entering upcoming trading sessions.
Get 3 Free Stock Ebooks
Discover top-performing stocks in AI, Crypto, and Technology with expert analysis.
- Top 10 AI Stocks - Leading AI companies
- Top 10 Crypto Stocks - Blockchain leaders
- Top 10 Tech Stocks - Tech giants


