
 Soars 30% Following US-Iran Ceasefire Announcement")
Key Takeaways
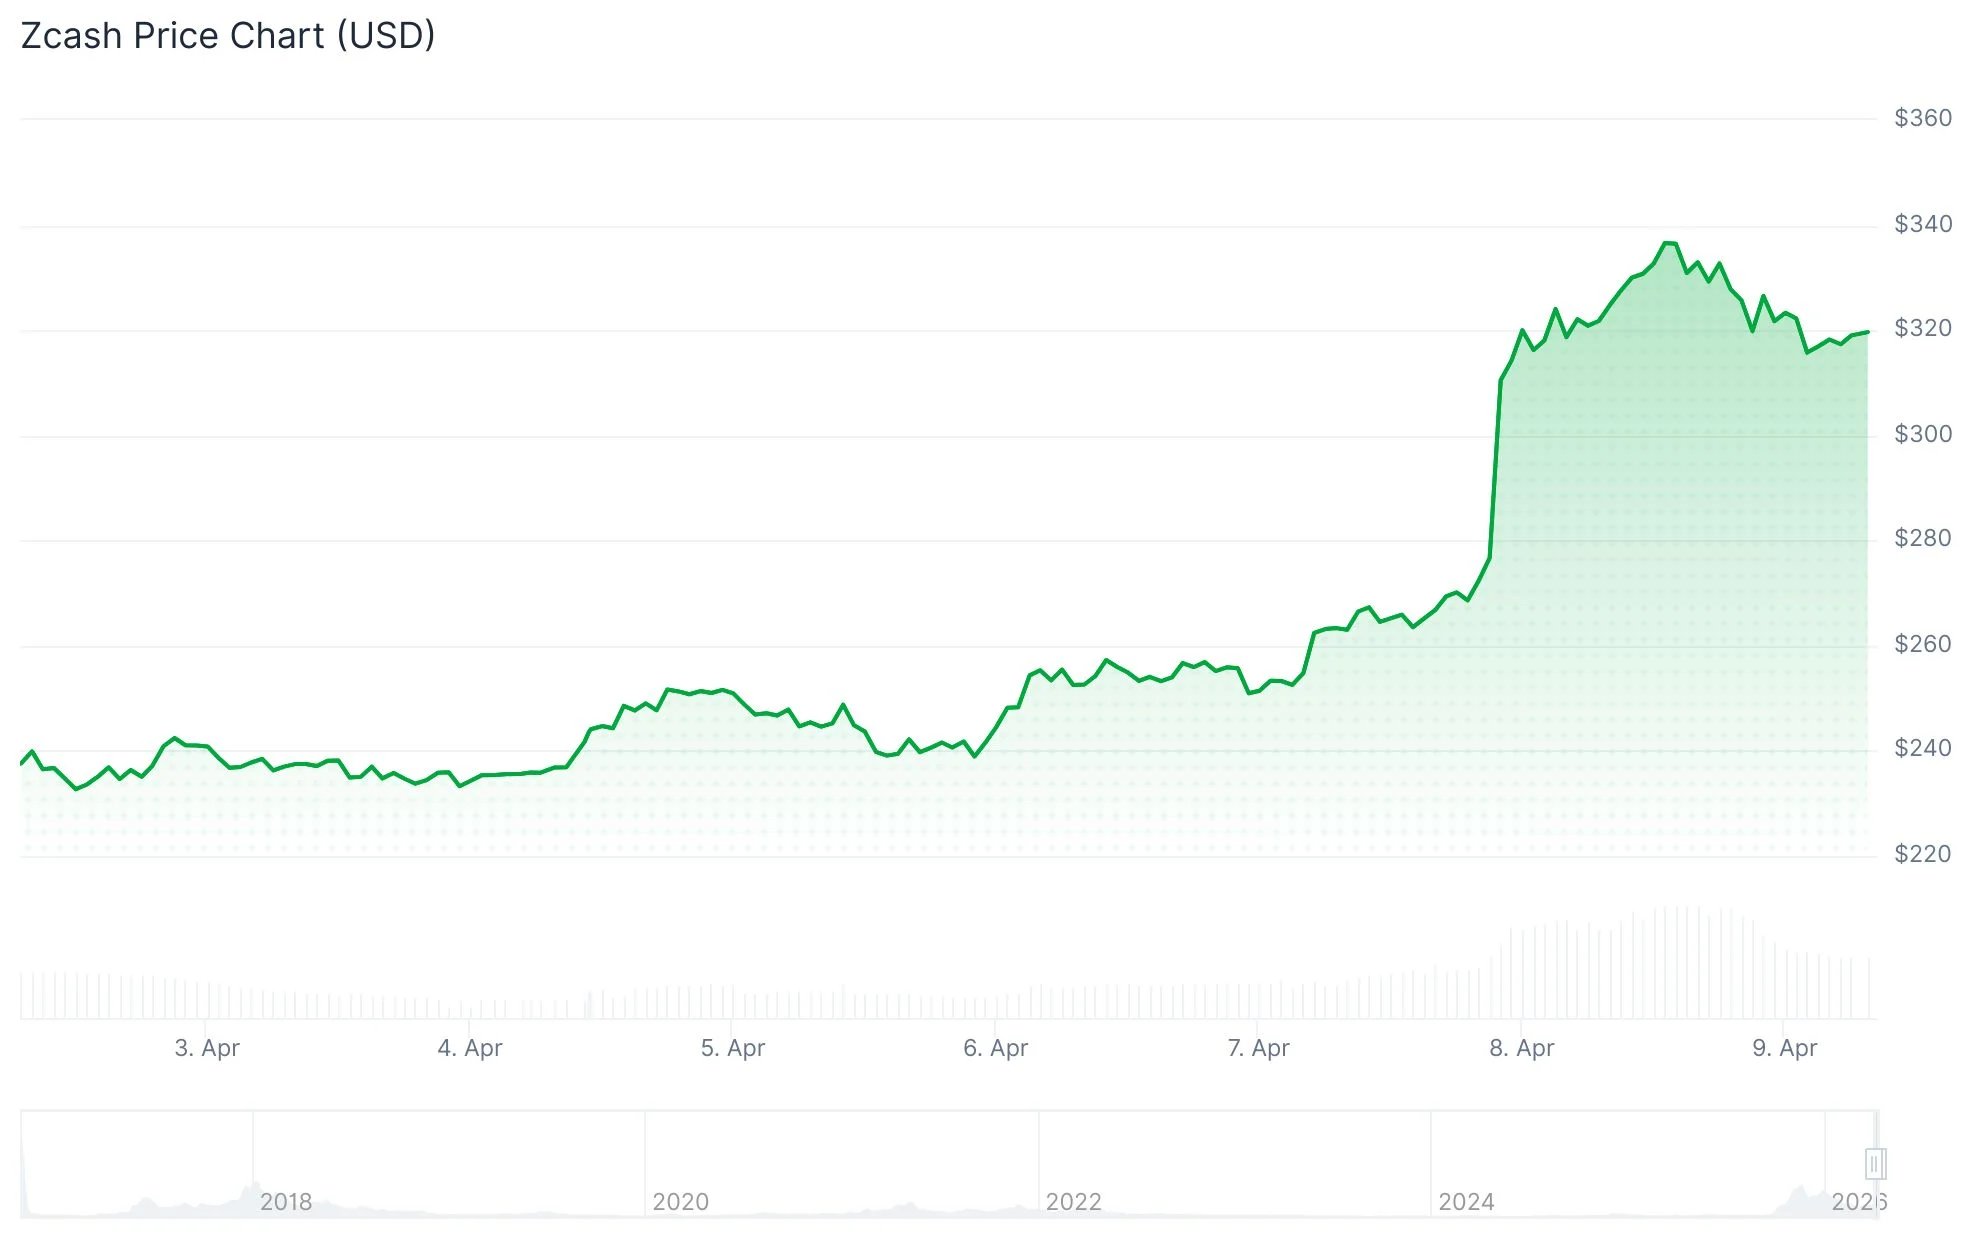
- ZEC experienced a dramatic 30%+ increase within a single day, climbing to $336.50—the highest level recorded since January
- President Trump’s announcement of a US-Iran ceasefire sparked the price movement
- Shielded pool assets on the Zcash network reached an unprecedented $5.18 billion
- More than $50 million in leveraged long positions below current levels present potential downside vulnerability
- Historical price patterns from 2021 indicate the possibility of a 40% retracement
On April 8, 2026, Zcash (ZEC) experienced a remarkable surge, climbing more than 30% within a 24-hour timeframe to touch $336.50. This price level marked the cryptocurrency’s strongest performance since early January, positioning ZEC among the day’s standout digital asset performers.
The explosive price action followed President Donald Trump’s declaration of a two-week ceasefire agreement involving the United States, Israel, and Iran. This diplomatic breakthrough reduced geopolitical uncertainty and triggered a widespread rally in risk-sensitive assets throughout worldwide financial markets.
During this same window, Bitcoin pushed beyond the $72,000 threshold. The aggregate cryptocurrency market capitalization expanded by 4.6% over the 24-hour period. Major altcoins including Ethereum and XRP similarly recorded positive price movements.
While competing privacy-focused cryptocurrencies also experienced gains, ZEC outperformed the category. Monero (XMR) registered a 3% advance and Dash (DASH) climbed 8%.
Zcash’s privacy-enhancing shielded pools simultaneously achieved a milestone on April 8. The total value locked within shielded pools reached $5.18 billion, accounting for 31.14% of the entire circulating token supply. These shielded pools function as a privacy mechanism that conceals transaction information from public view.

The Zcash Open Development Lab secured $25 million in financing from prominent venture capital investors recently. These funds are designated to advance ecosystem development initiatives in the coming period.
Chart Analysis Suggests Overextension
The Relative Strength Index (RSI) climbed to 87 on the 4-hour timeframe, pushing ZEC into clearly overbought conditions. Meanwhile, the MACD indicator continues displaying positive readings, confirming that near-term bullish momentum persists.
A critical resistance barrier exists around the $370 mark, which aligns with both a downward-sloping trendline and the 0.5 Fibonacci retracement threshold. Should ZEC successfully breach this level, the subsequent price objective stands at $400.
However, failure to overcome the trendline resistance could trigger a decline toward the $197–$200 support area. Market analysts have noted that the current chart formation mirrors a configuration observed in 2021, when ZEC topped out near $392 before transitioning into an extended bearish phase.
Leverage Maps Indicate Elevated Downside Exposure
The Binance ZEC/USDT liquidation heatmap reveals approximately $50.56 million in leveraged long positions positioned beneath the current trading price. A breakdown below $260 would likely trigger mass liquidations of these holdings.
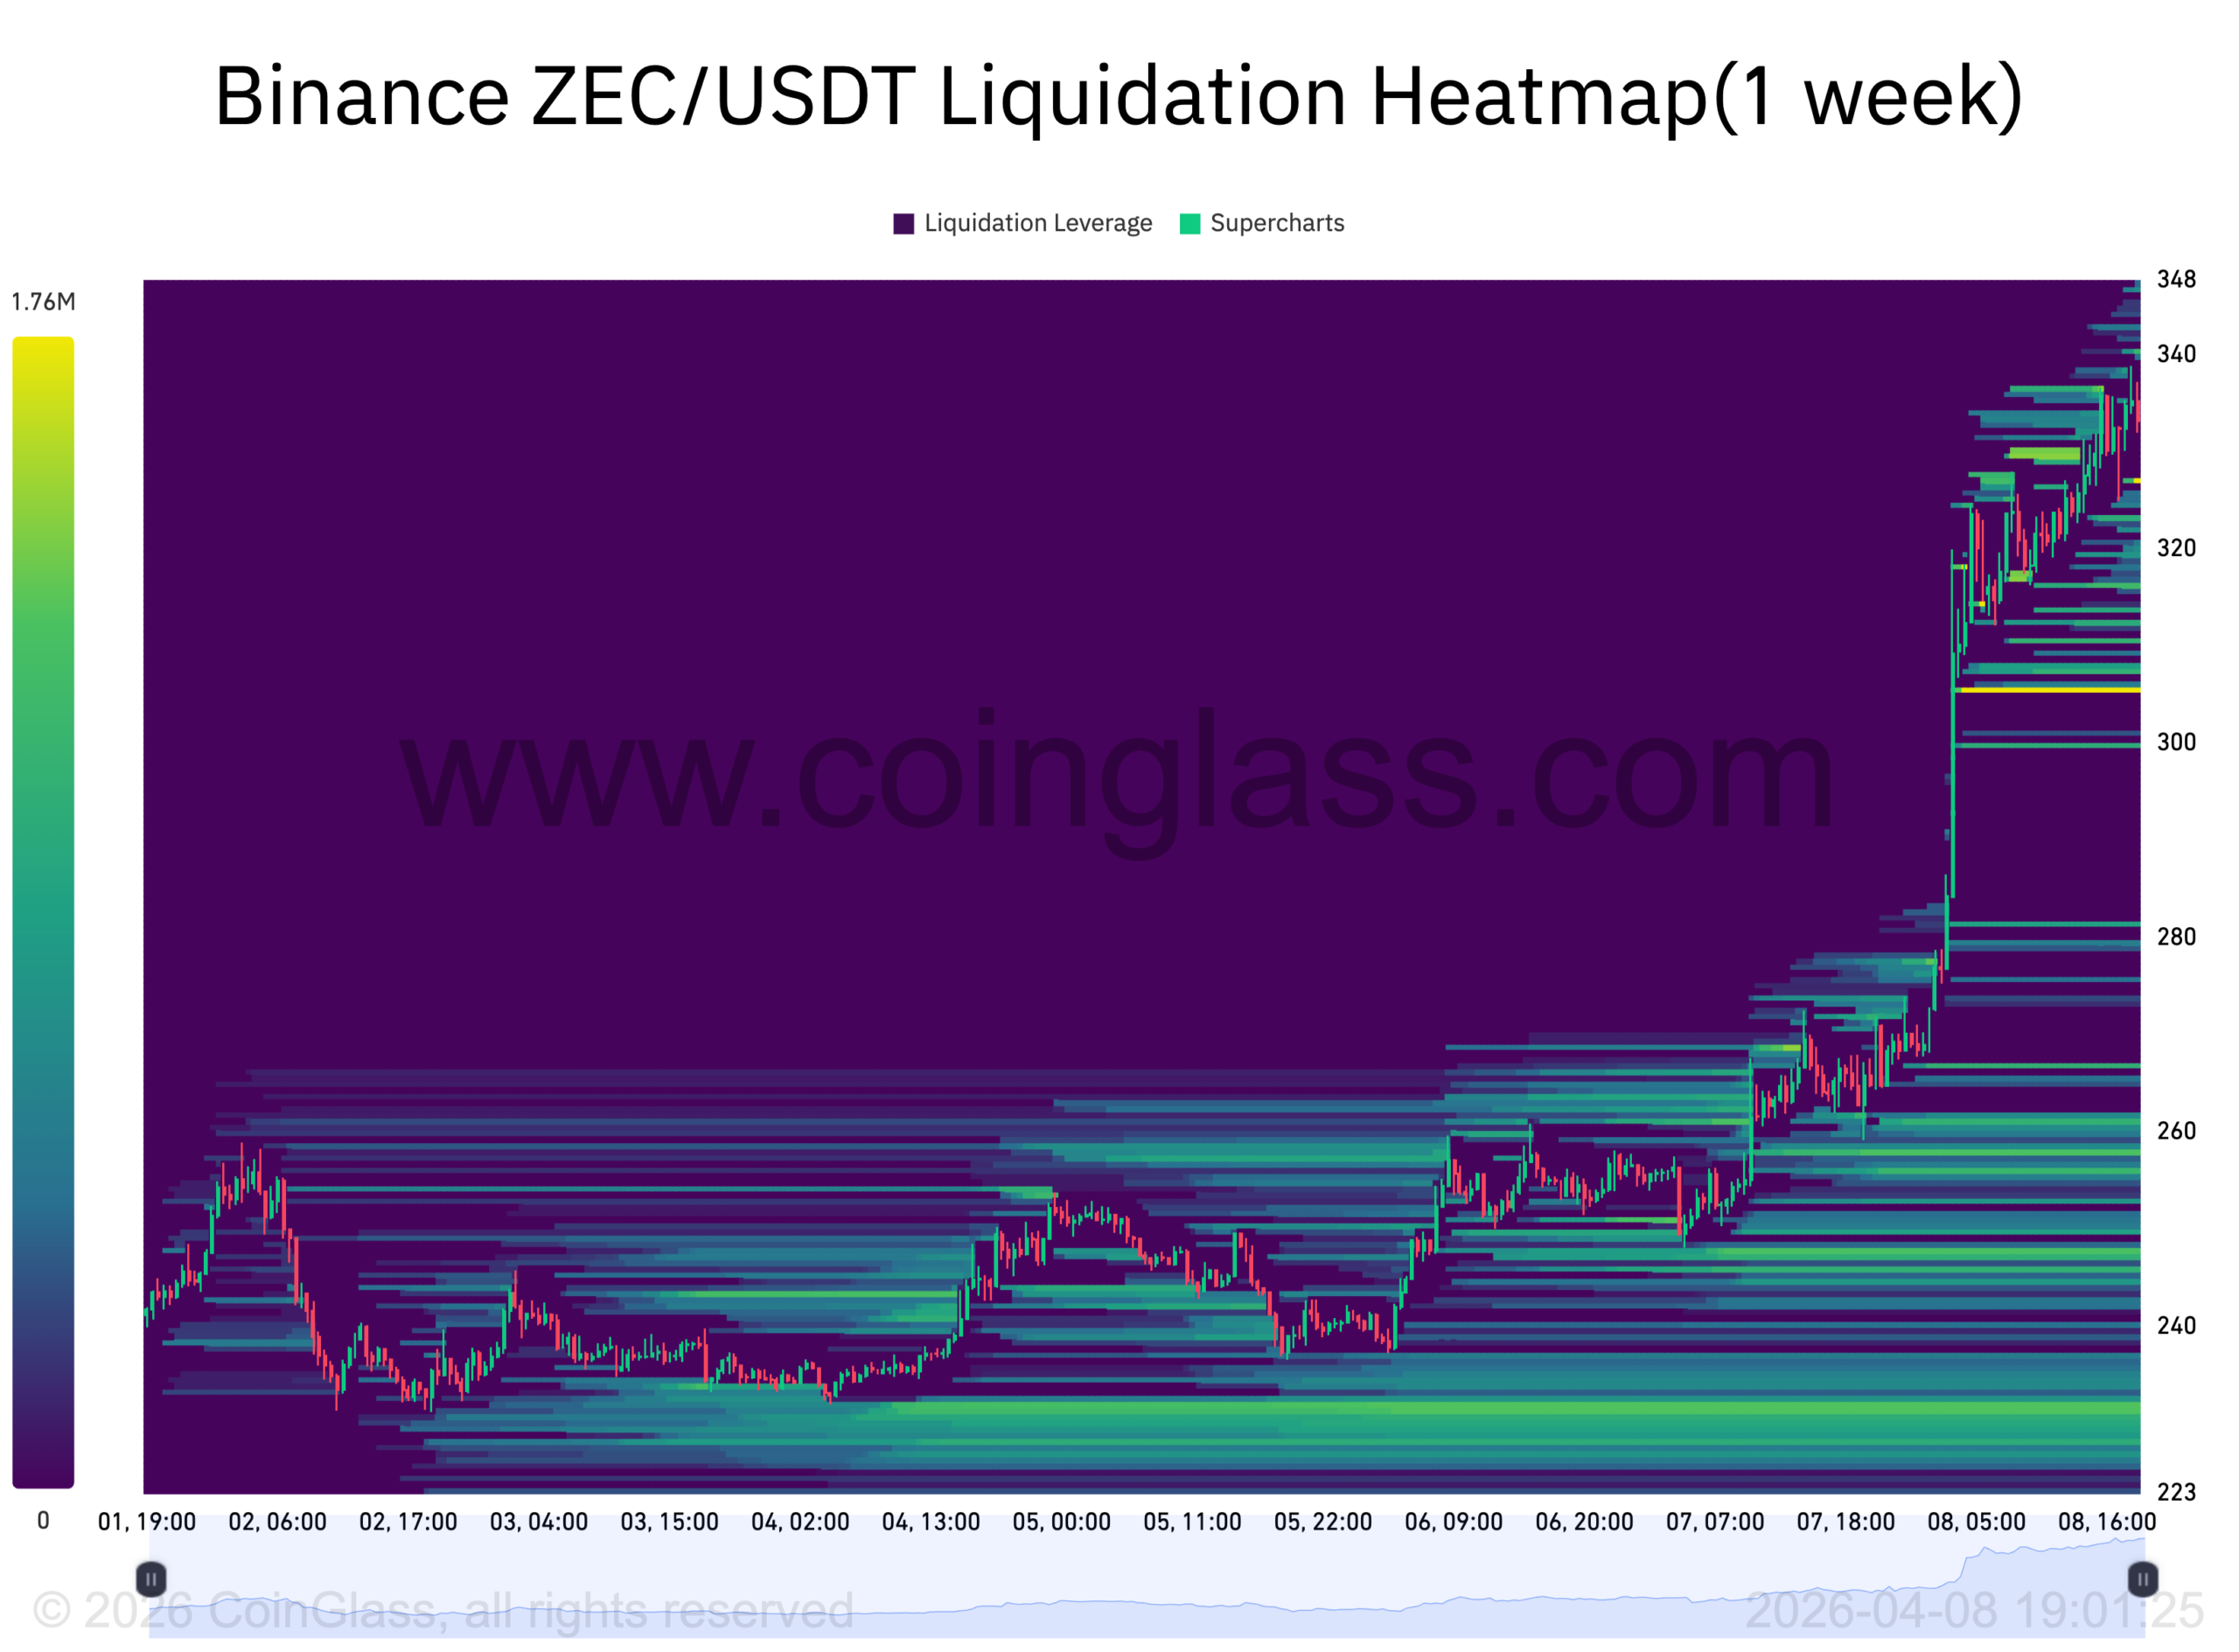
By contrast, merely $3.81 million in short liquidations are stacked above $380. This asymmetric distribution indicates the market faces significantly greater vulnerability to downward price action compared to upward movement.
The most concentrated liquidation cluster resides within the $305–$306 price band, containing roughly $1.76 million in leveraged positions.
As of April 8, ZEC was changing hands near $318, representing a substantial recovery from earlier weekly lows.
Get 3 Free Stock Ebooks
Discover top-performing stocks in AI, Crypto, and Technology with expert analysis.
- Top 10 AI Stocks - Leading AI companies
- Top 10 Crypto Stocks - Blockchain leaders
- Top 10 Tech Stocks - Tech giants


