
 Price: Long Traders Feel the Heat as $8.44M Gets Liquidated in 24 Hours")
TLDR
- XRP price reached $2.65 before pulling back to around $2.51-$2.53
- Support levels exist at $2.48-$2.51, with resistance at $2.58-$2.60
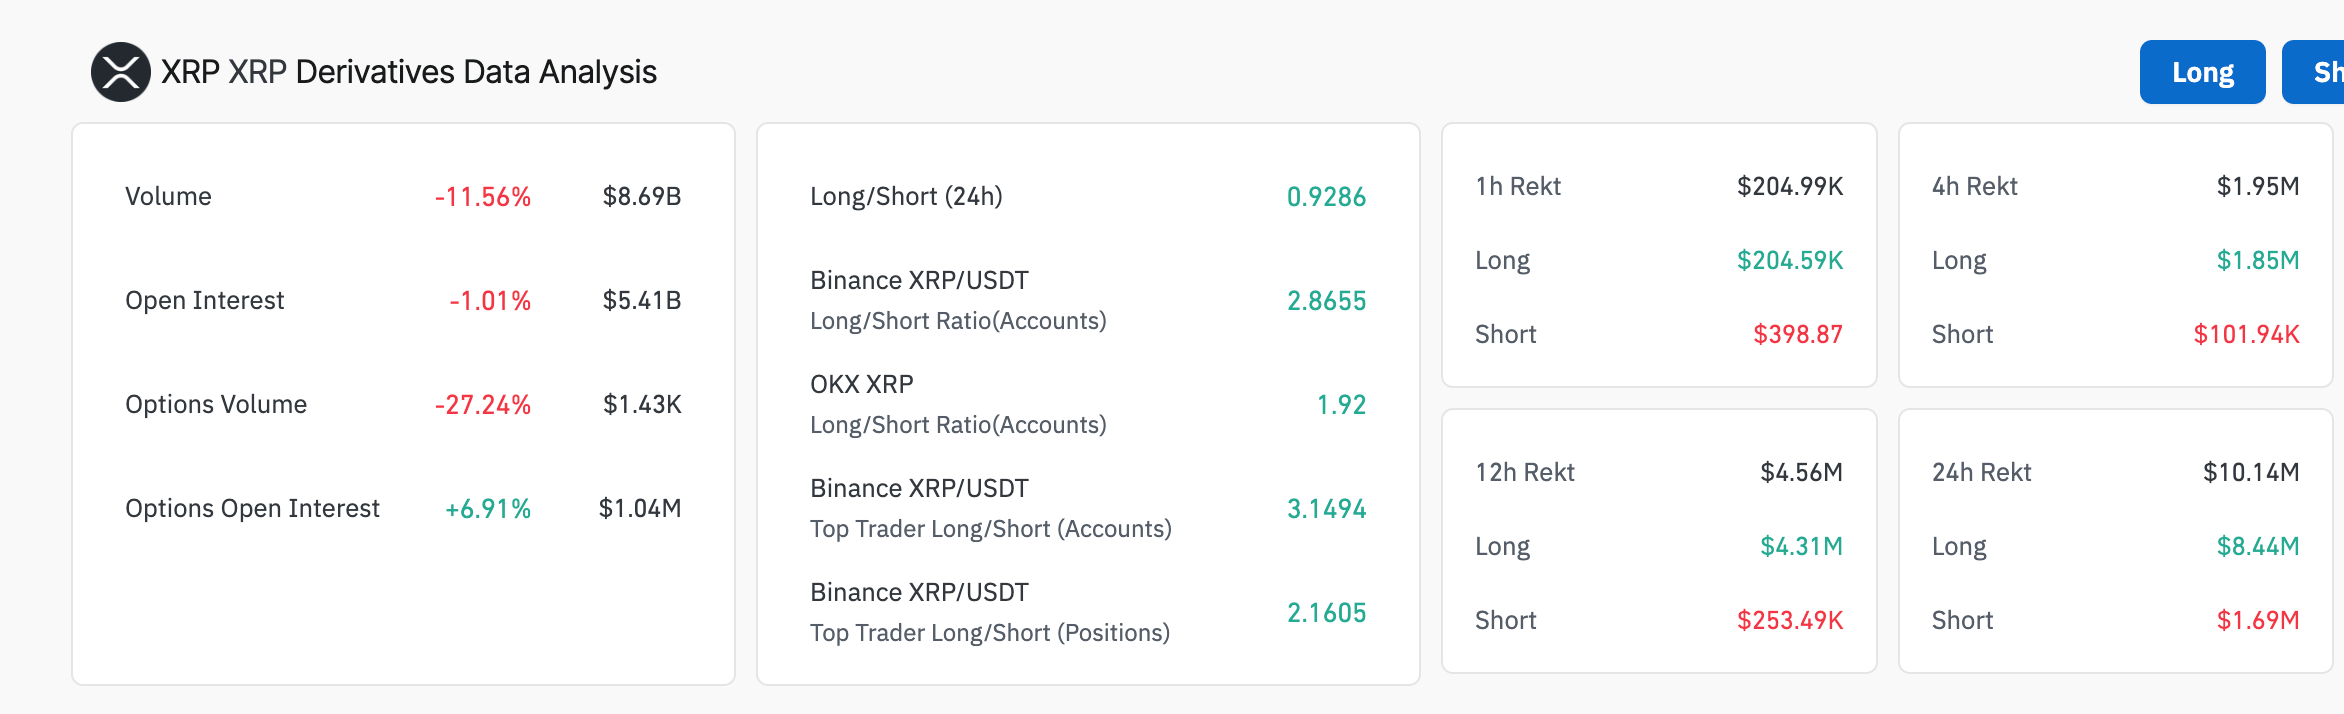
- Long liquidations have surged to $8.44 million in the past 24 hours
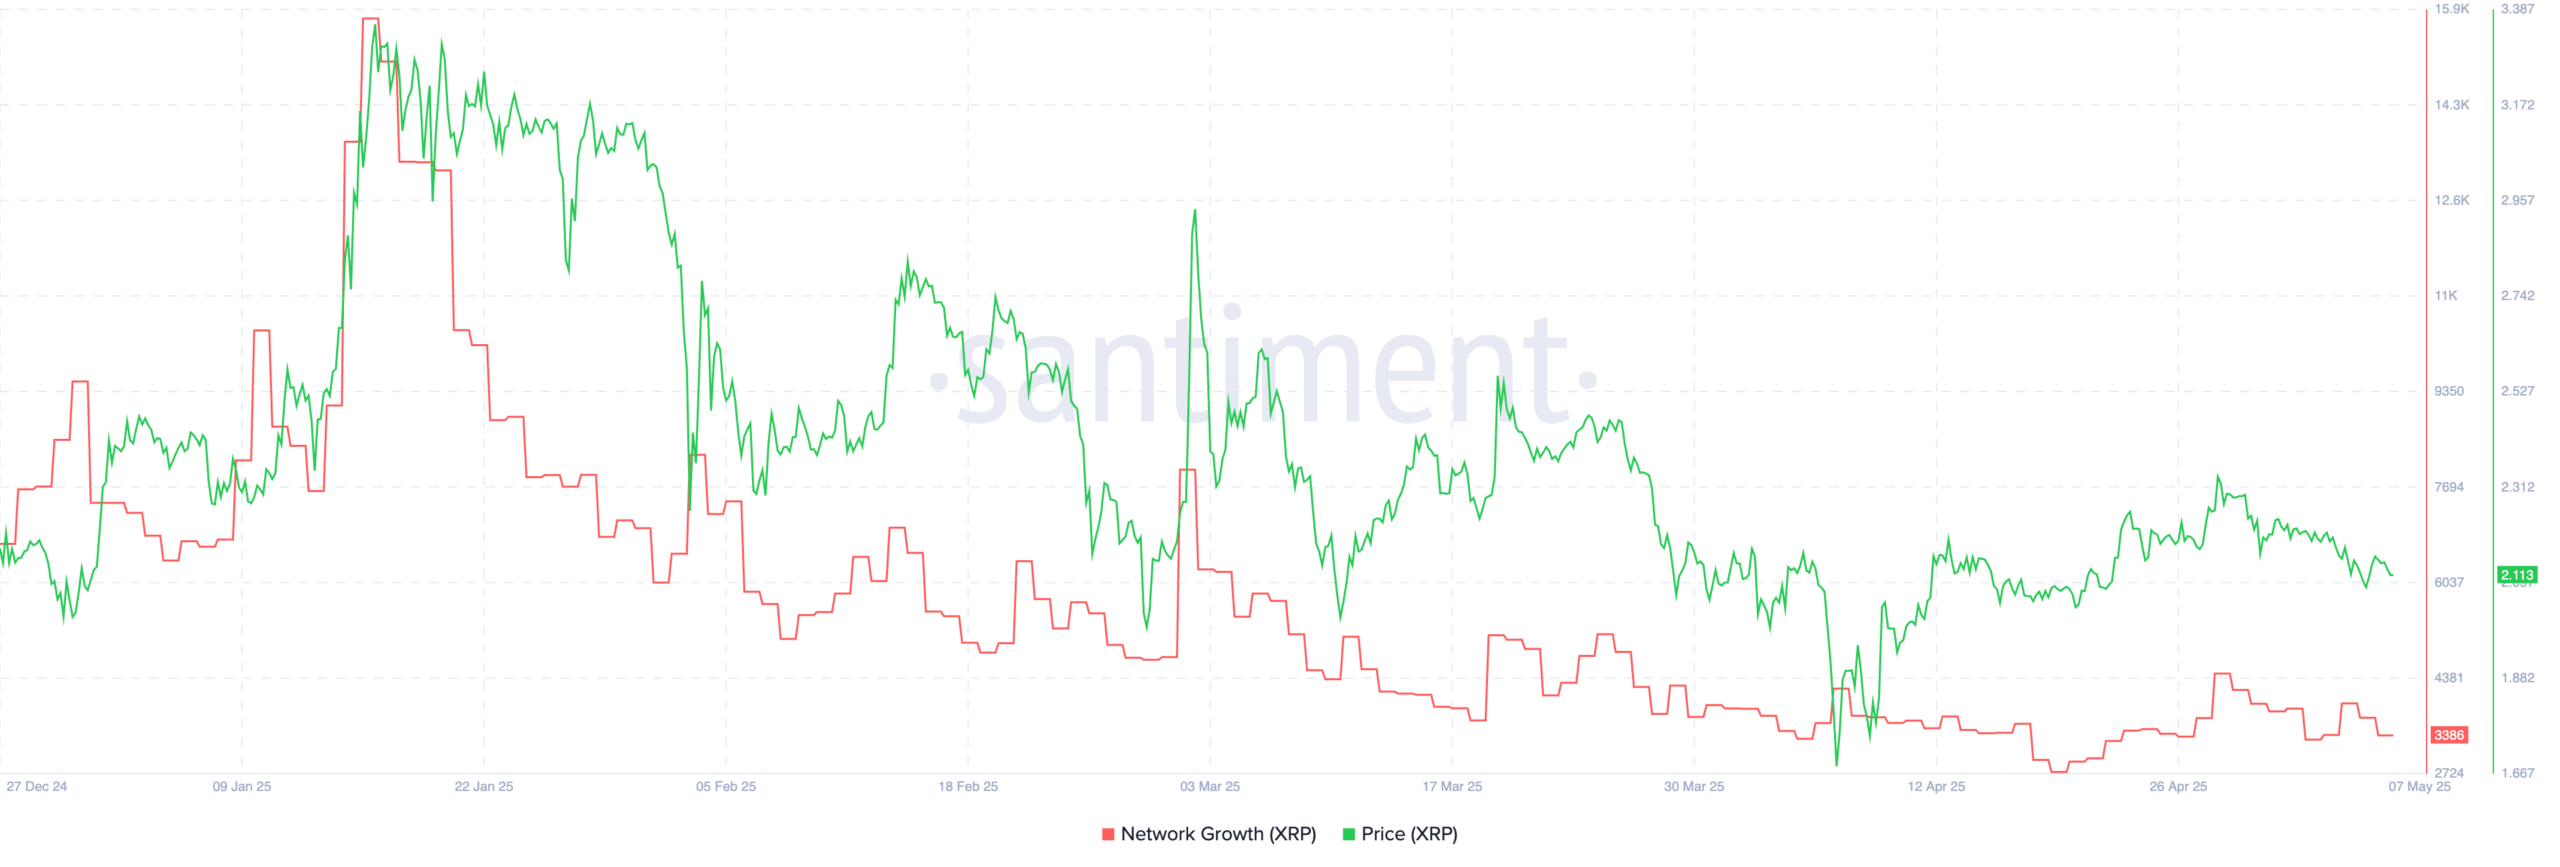
- Network growth on XRP Ledger has declined significantly since January
- Price remains above key moving averages, suggesting the uptrend may continue despite the pullback
XRP (XRP) price has experienced a pullback after reaching a peak of $2.65 on Wednesday, currently trading around $2.51-$2.53. This movement comes after a sustained two-week upward streak that saw the cryptocurrency climb from support levels around $2.12.
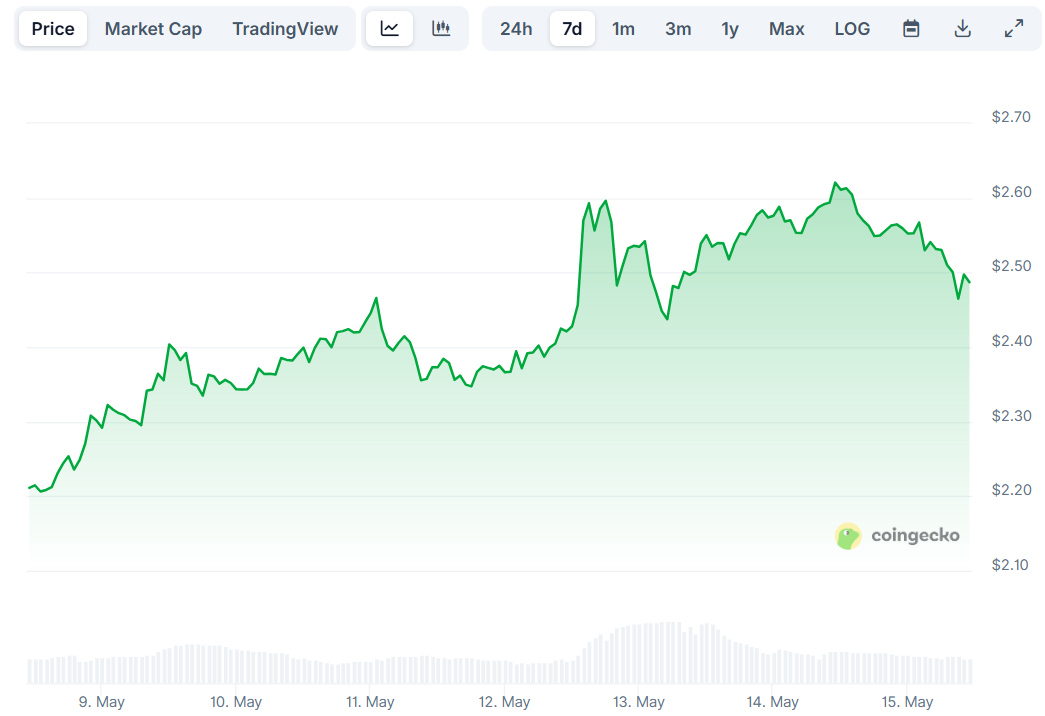
The recent price action shows XRP remains above the $2.50 mark and the 100-hourly Simple Moving Average, indicating bulls are still present in the market despite the correction.
Technical analysis reveals that XRP broke below a key bullish trend line with support at $2.55 on the hourly chart. The price dipped below the 50% Fibonacci retracement level of the recent upward move from $2.42 to $2.65.
On the upside, XRP faces resistance near $2.55, with major resistance points at $2.58 and $2.60. A clear break above $2.60 could potentially send the price toward $2.65 again, with further resistance at $2.72 and $2.75.
For downside risk, initial support exists near $2.51 and the 61.8% Fibonacci retracement level. The next major support sits at $2.48, with further support zones at $2.45 and $2.42 if the decline continues.
Market Factors and On-Chain Metrics
The broader market context shows positive developments with progressive talks between the United States and China resulting in a 90-day trade truce, helping accelerate recovery in global markets. Earlier, the US and UK struck a bilateral trade agreement easing trade between the two nations.

However, on-chain metrics tell a different story for XRP specifically. Network activity has been on a consistent decline, dropping from nearly 16,000 addresses in January to approximately 3,400 addresses by May 7. This 78.7% reduction in network growth indicates fewer new addresses being created and potentially reduced user engagement.
The derivatives market for XRP shows increasing liquidations, with $10.14 million liquidated in the past 24 hours. Long positions accounted for $8.44 million of these liquidations, compared to just $1.69 million in shorts.
Trading volume has also decreased to $8.69 million from approximately $19.5 million on Monday, suggesting tightening liquidity. Open interest saw a slight decline of 1% to $5.41 billion, indicating some unwinding of leveraged positions.
Despite these concerns, XRP’s price remains significantly above key moving averages, including the 50-day, 100-day, and 200-day Exponential Moving Averages (EMA). This positioning suggests underlying strength in the market.
The Moving Average Convergence Divergence (MACD) indicator maintains a buy signal above the center line, supported by green histograms. This technical signal highlights sustained bullish momentum that could potentially help XRP resume its uptrend toward the $3.00 psychological level.
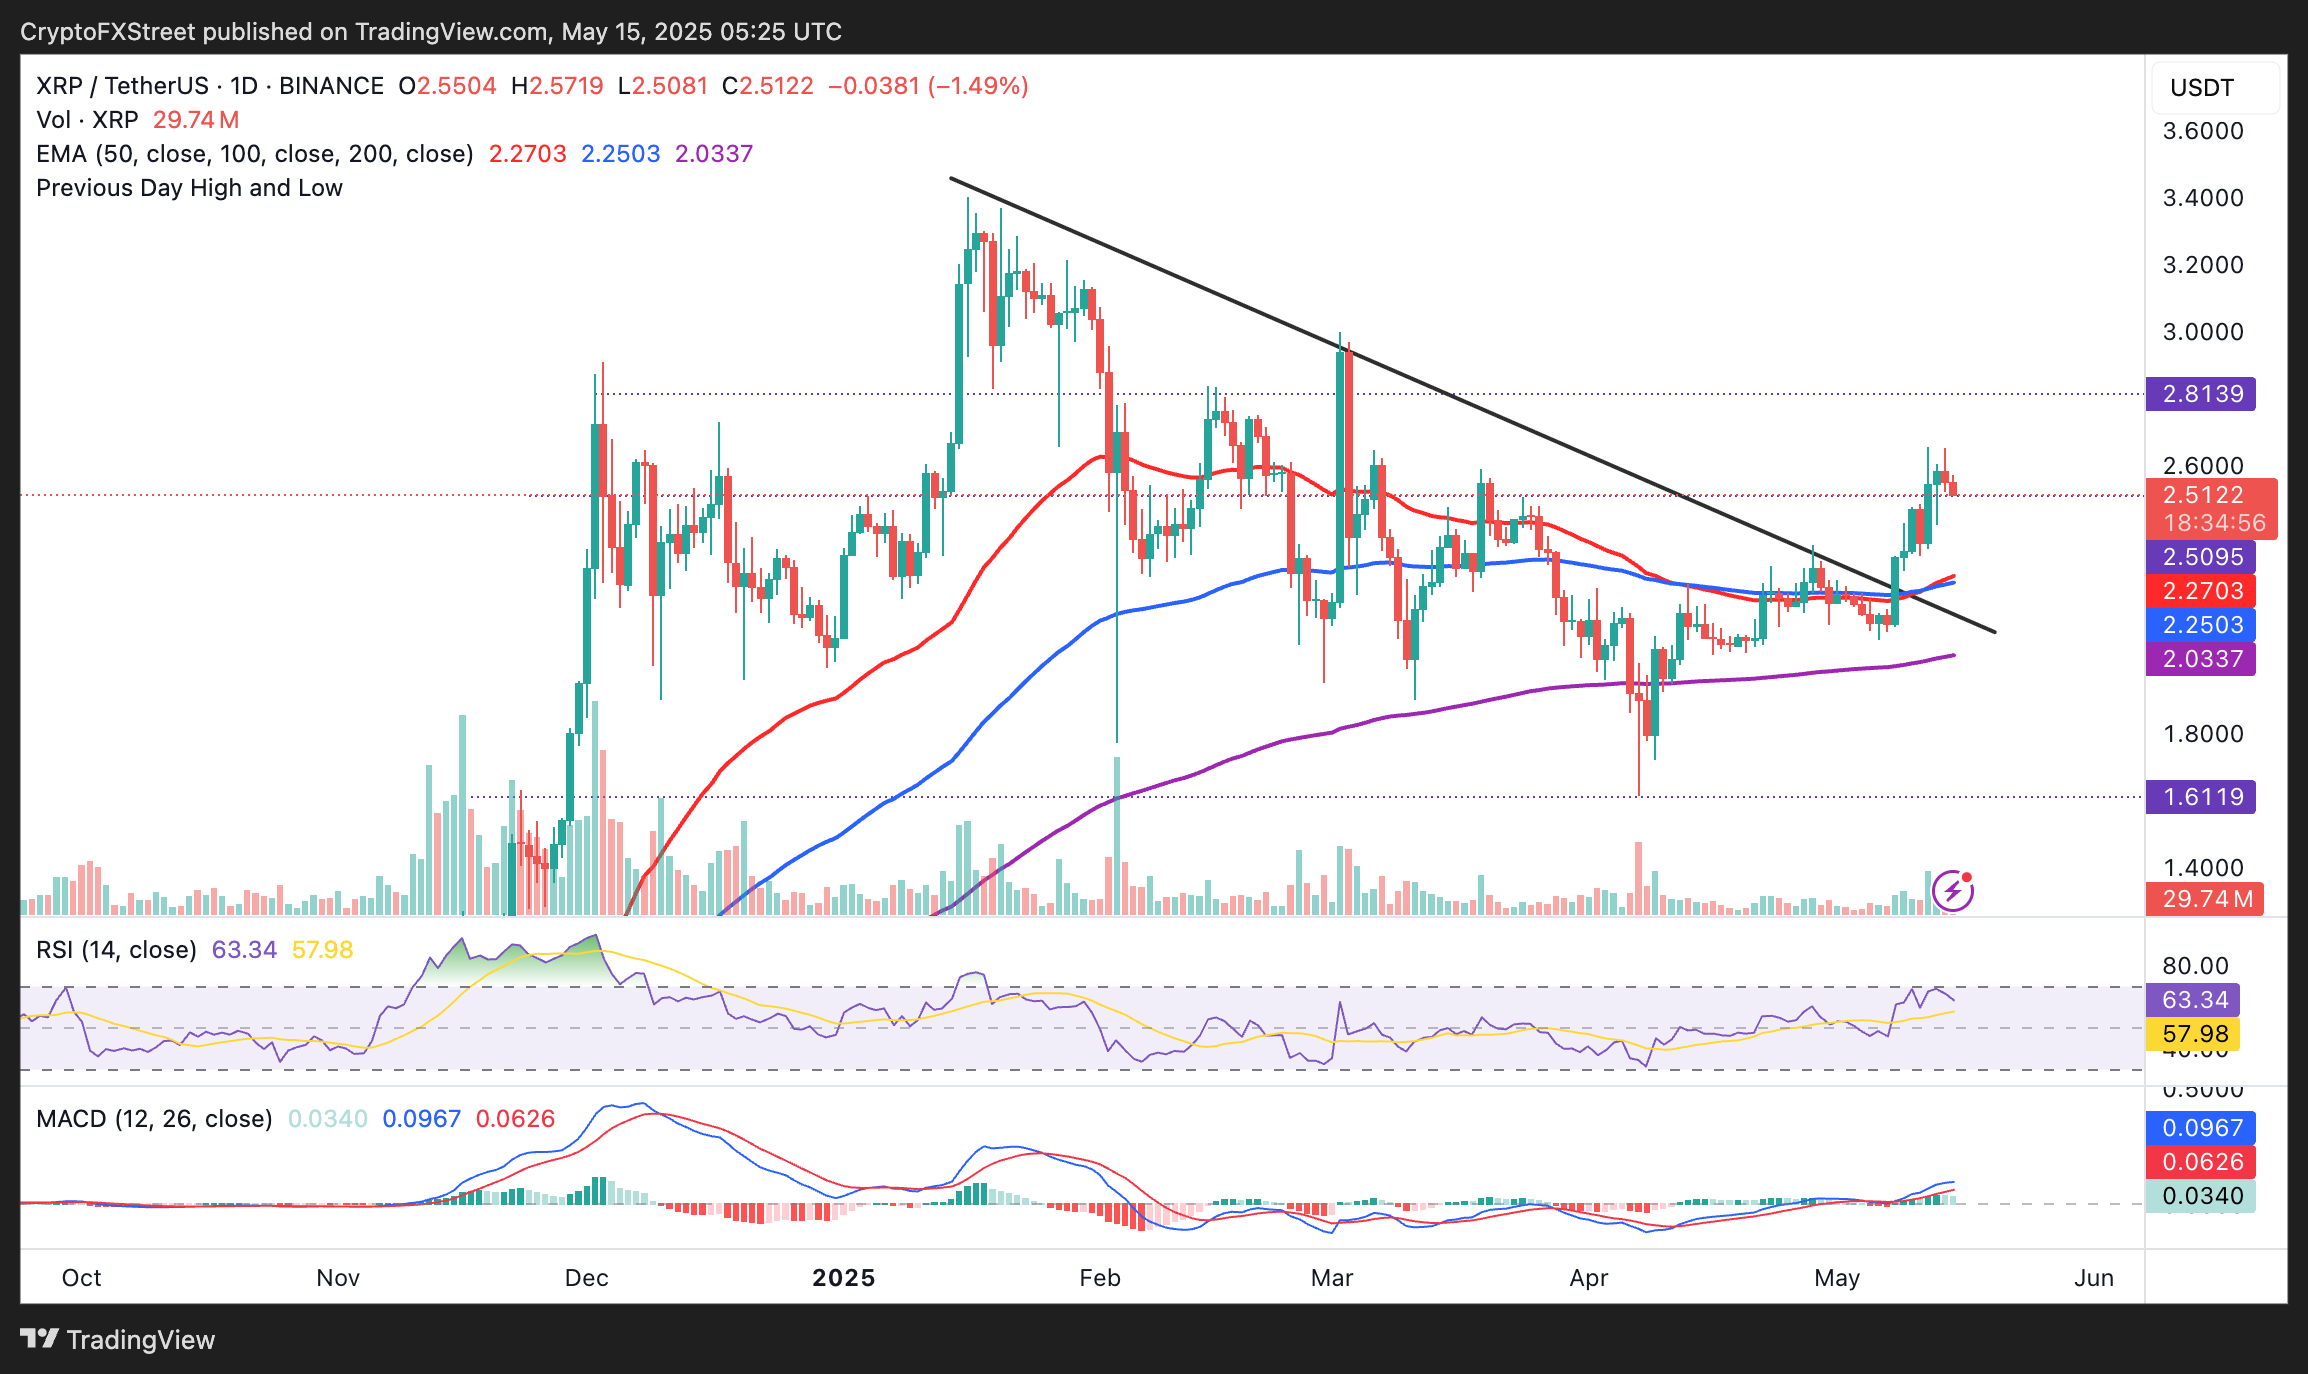
However, traders should remain cautious as the Relative Strength Index (RSI) sits at 63.34 and is sliding toward the midline of 50, which could signal weakening upward momentum.
If the downtrend extends in upcoming sessions, particularly with potential profit-taking, support levels to watch include the 50-day EMA at $2.27, the 100-day EMA at $2.25, and the 200-day EMA at $2.00.
For now, XRP continues to trade above $2.50, maintaining much of its recent gains despite the pullback from Wednesday’s peak.
Get 3 Free Stock Ebooks
Discover top-performing stocks in AI, Crypto, and Technology with expert analysis.
- Top 10 AI Stocks - Leading AI companies
- Top 10 Crypto Stocks - Blockchain leaders
- Top 10 Tech Stocks - Tech giants


