
 Price Analysis: Token Tests Critical $1.40 Resistance Level")
Quick Overview
- XRP surged past a key bearish trendline on the hourly timeframe, signaling renewed bullish momentum.
- The digital asset peaked at $1.3963 before experiencing minor consolidation, maintaining position above the 100-hour MA.
- Critical resistance territory between $1.3880 and $1.40 remains the focal point for market participants.
- Key downside protection levels are established around $1.3575 and $1.3330.
- Recent institutional inflow data and regulatory developments provide backdrop, though technical indicators show conflicting signals.
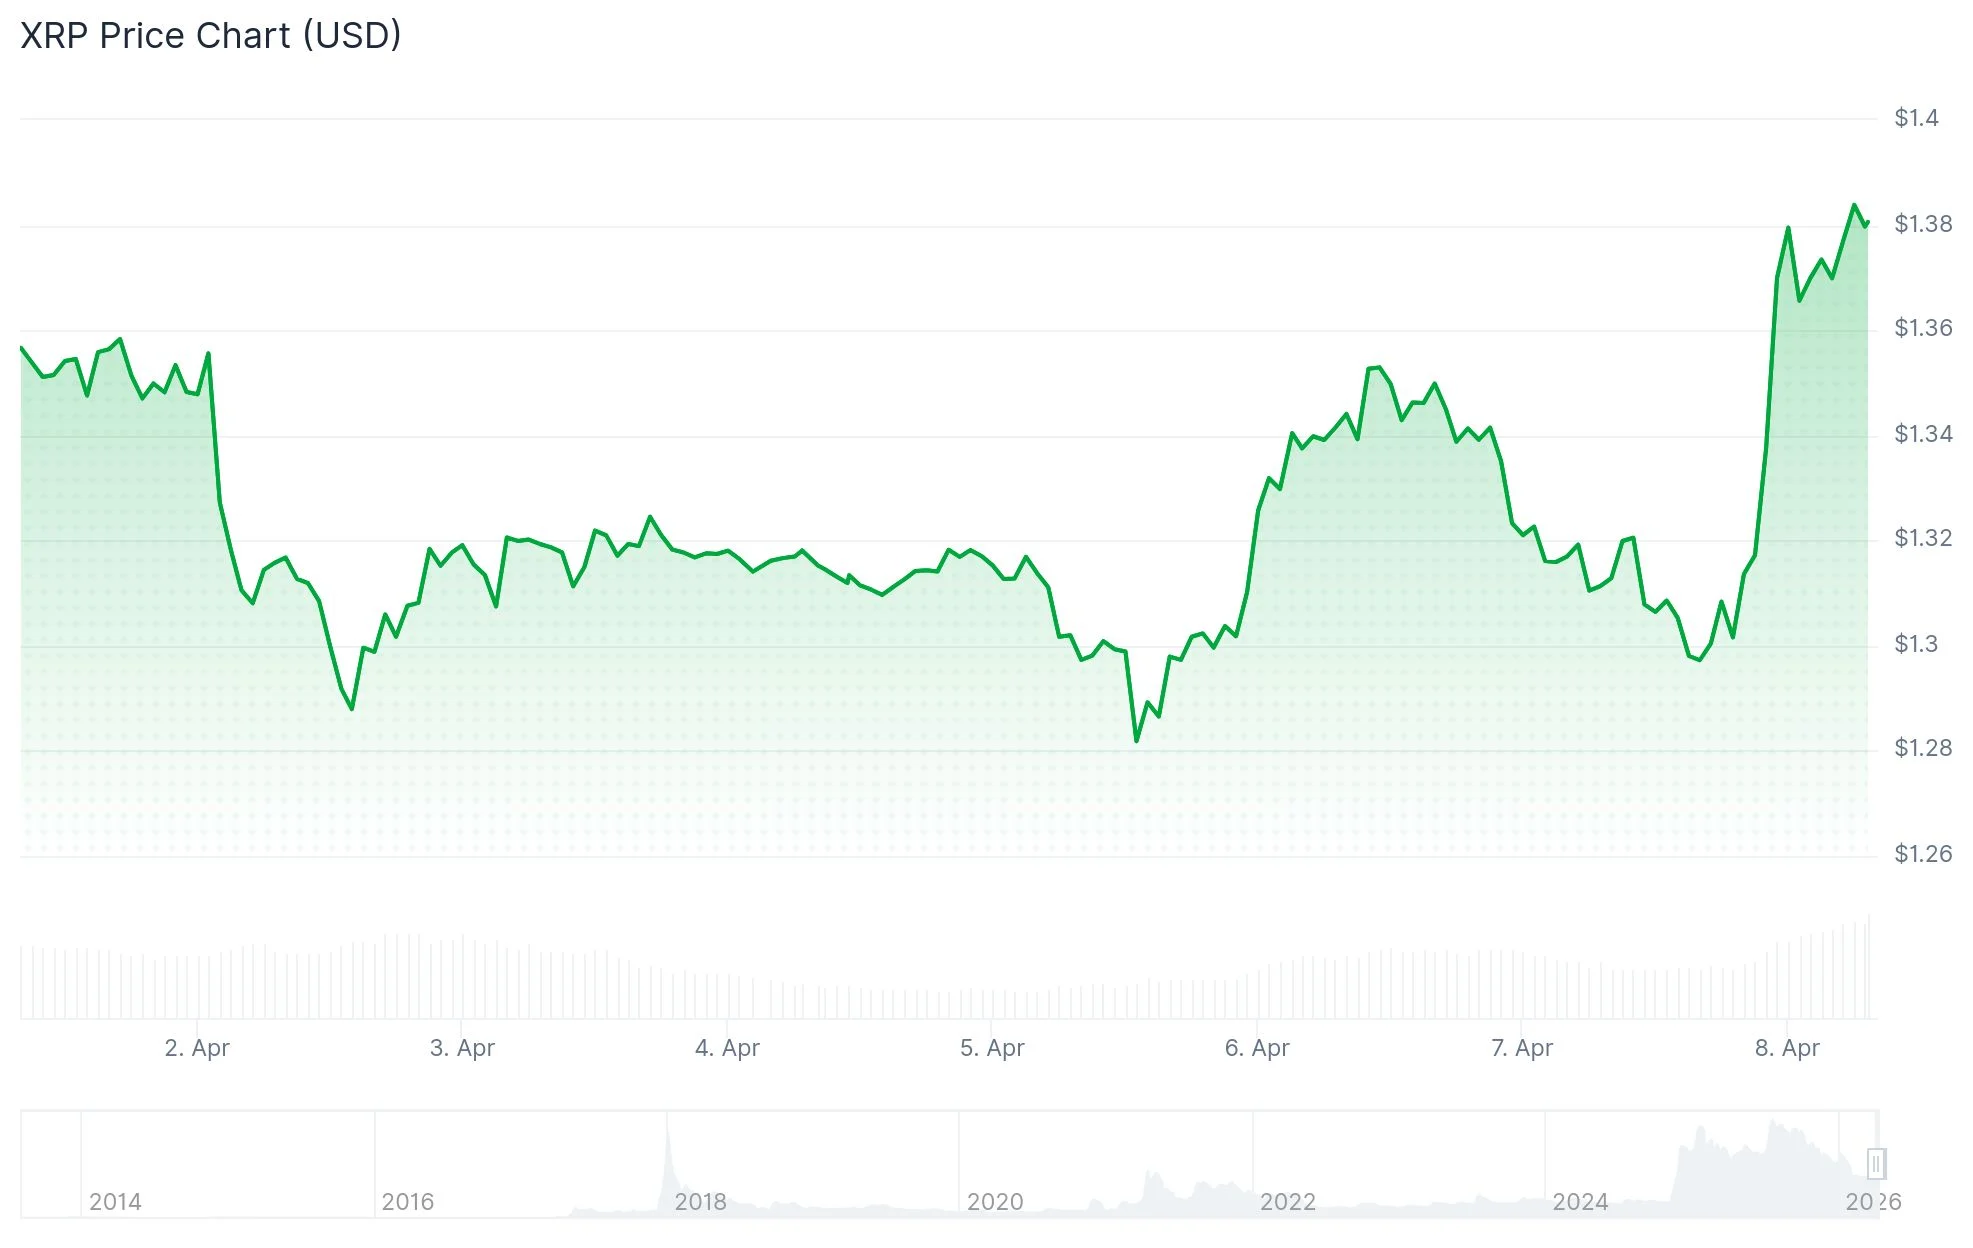
XRP (XRP) registered substantial gains during the latest trading session, climbing toward the psychologically significant $1.40 threshold. The cryptocurrency hovered around $1.38 following an intraday peak of $1.3963.
The bullish momentum initiated when XRP cleared the $1.350 and $1.3550 price points. Market bulls subsequently drove the asset through the $1.3650 barrier.
Hourly chart analysis reveals XRP successfully breached a descending trendline that had provided resistance around $1.3350. This technical breakout provided additional fuel for the upward trajectory.
Following the $1.3963 high, XRP experienced modest profit-taking. Nevertheless, the token held ground above $1.3550 and the 100-hour simple moving average.
Market focus has now shifted to upcoming resistance barriers. Participants are monitoring whether XRP can overcome $1.3880 followed by the round number at $1.40.

Critical Resistance Territory Ahead
Should XRP successfully breach $1.40, subsequent upside targets emerge at $1.4250 and $1.4450. Further gains could bring $1.4650 into play as the next obstacle.
Near-term technical structure indicates bullish forces remain dominant. The asset maintains its position above crucial moving average support following the recent advance.
Market data indicated XRP posted a 5.63% daily increase, trading near $1.3848. Analysis positioned XRP above its 20-day exponential moving average, though it continues trading beneath both the 50-day and 200-day averages.
Technical indicators reveal the Ichimoku Kijun positioned near $1.4429. This metric reinforces the resistance cluster forming above current price levels.
Downside Support Zones Identified
In the event XRP cannot penetrate the $1.3880 resistance cluster, downside action could materialize. Initial support emerges near $1.3575.
Further weakness would target the $1.3330 zone. This price level coincides with the 61.8% Fibonacci retracement measured from the $1.2940 low to the $1.3963 high.
A decisive move below $1.3330 would bring $1.3080 and $1.3020 into focus. Additional major support beneath those levels appears near $1.2750.
Separate analysis noted XRP has consolidated within a narrow $1.37 to $1.39 channel despite robust institutional demand. US-listed spot XRP exchange-traded funds have accumulated over $1 billion in assets since their debut, with $224 million flowing in during the most recent seven-day period.
The assessment highlighted diverging momentum signals, with the Relative Strength Index suggesting bullish conditions while the Stochastic RSI indicates overbought territory. Market analyst Anton Kharitonov indicated a cautious stance until XRP decisively clears $1.39.
Finance Bull noted XRP appeared to be initiating a breakout following the two-week ceasefire announcement and Strait of Hormuz reopening developments, proposing this could catalyze sustained upward momentum. While expressing optimistic sentiment, the commentary lacked specific technical price objectives or chart-based projections.
Current technical reality shows XRP confronting the $1.3880 to $1.40 resistance band following its advance from the $1.2940 base.
Get 3 Free Stock Ebooks
Discover top-performing stocks in AI, Crypto, and Technology with expert analysis.
- Top 10 AI Stocks - Leading AI companies
- Top 10 Crypto Stocks - Blockchain leaders
- Top 10 Tech Stocks - Tech giants


