
 Faces Bearish Technical Setup as Massive Exchange Deposits Signal Trouble")
TLDR
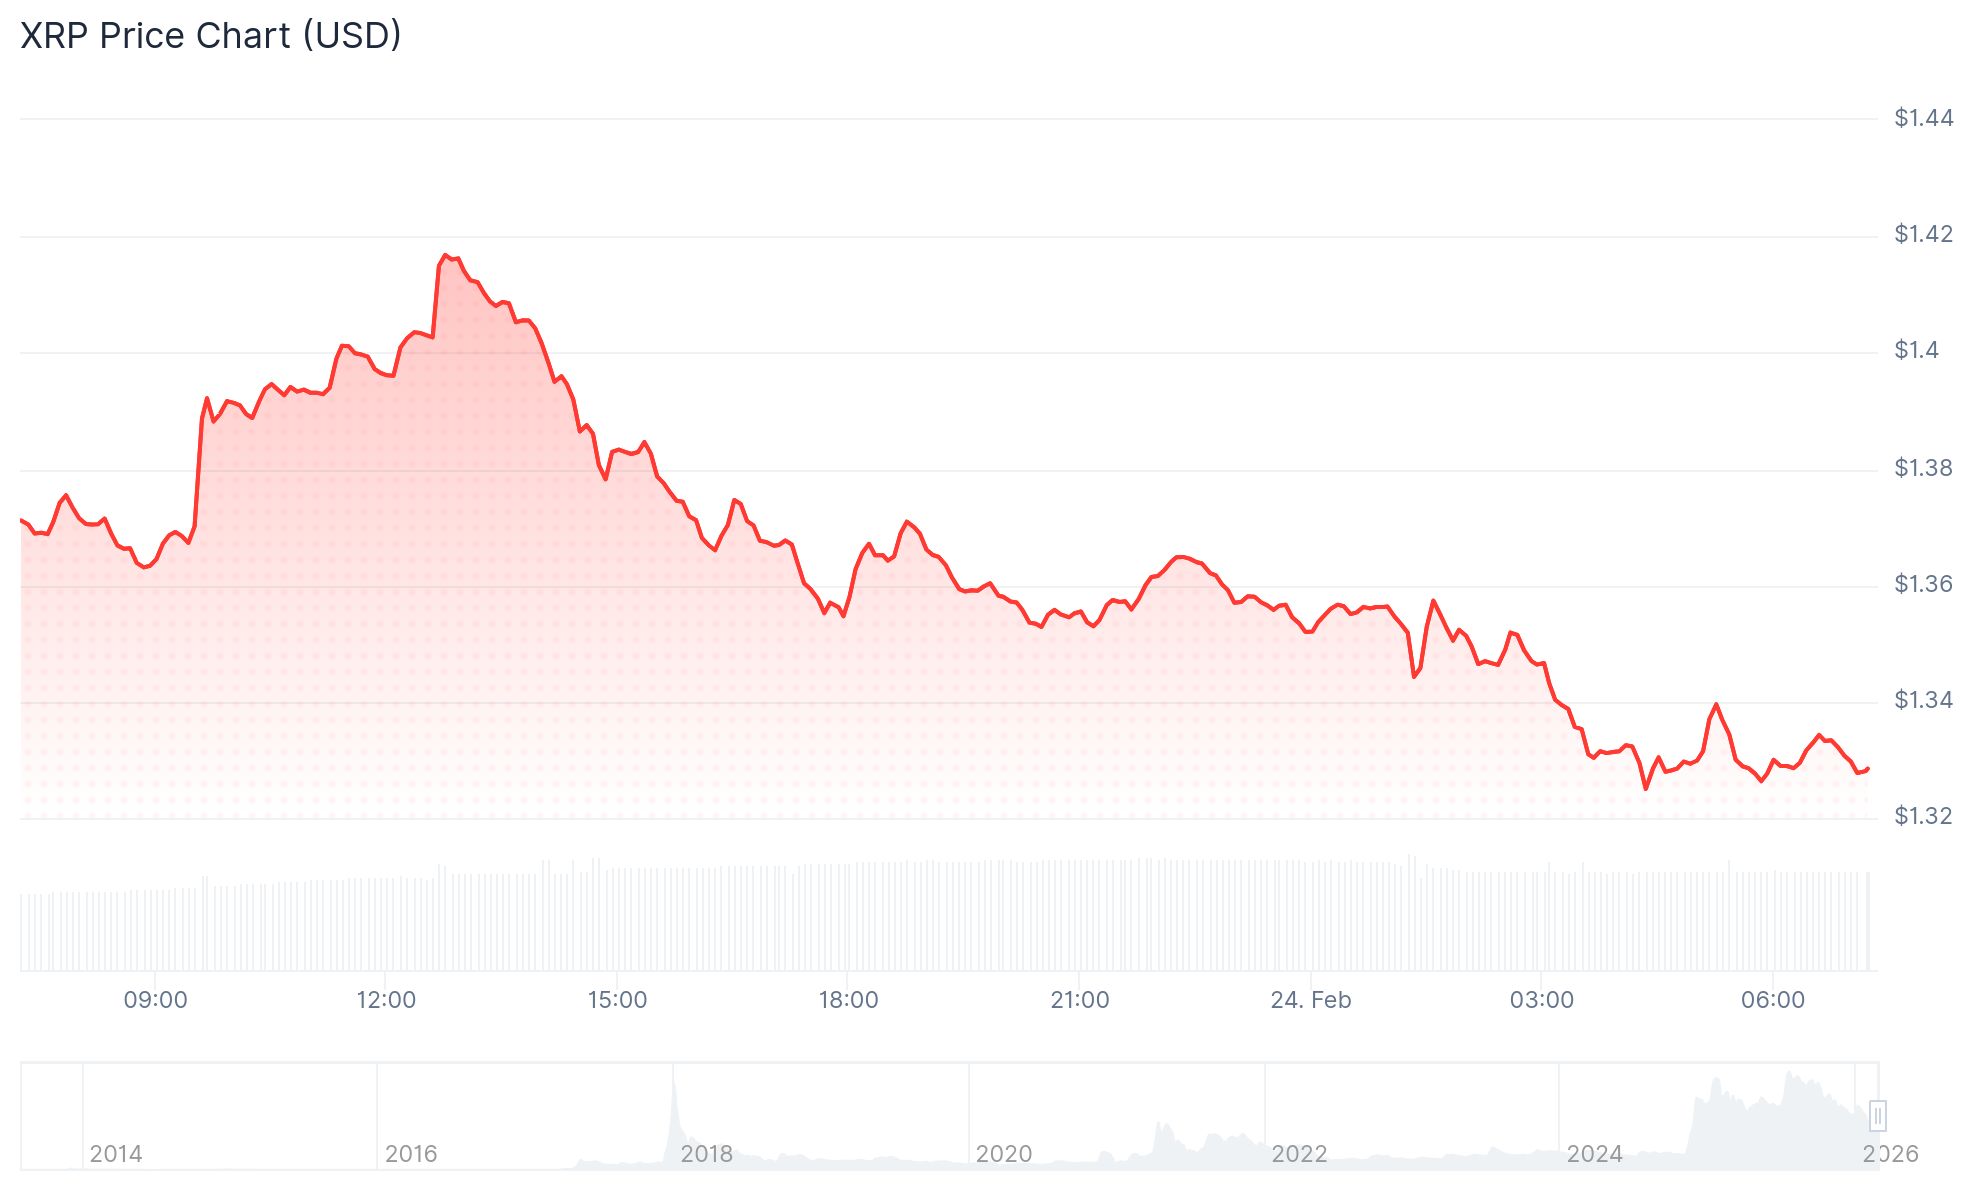
- XRP currently hovers between $1.33 and $1.36, declining approximately 9% in the last seven days
- Technical analysis reveals a bear pennant formation on the two-day timeframe, suggesting potential downside to $0.80
- More than 31 million XRP tokens were deposited to Binance on February 21, marking the highest exchange inflow since January 20
- While the broader cryptocurrency fund market experienced $288 million in outflows weekly, XRP attracted small positive inflows
- Critical support level identified at $1.32; breaking below $1.20 may trigger intensified downward momentum
Ripple’s XRP is currently hovering around $1.33 following a nearly 9% decline throughout the past week. The digital asset has dropped beneath important moving average levels amid mounting bearish pressure.
Technical charts show a bear pennant developing on XRP’s two-day timeframe. This classic continuation pattern typically emerges following a steep decline, then consolidates within converging trendlines. Traders often interpret this formation as a precursor to additional downside movement.
The pattern’s flagpole originated when XRP plummeted toward the $1.12 region. Subsequently, price action has contracted into a tightening triangular formation beneath critical moving average indicators.
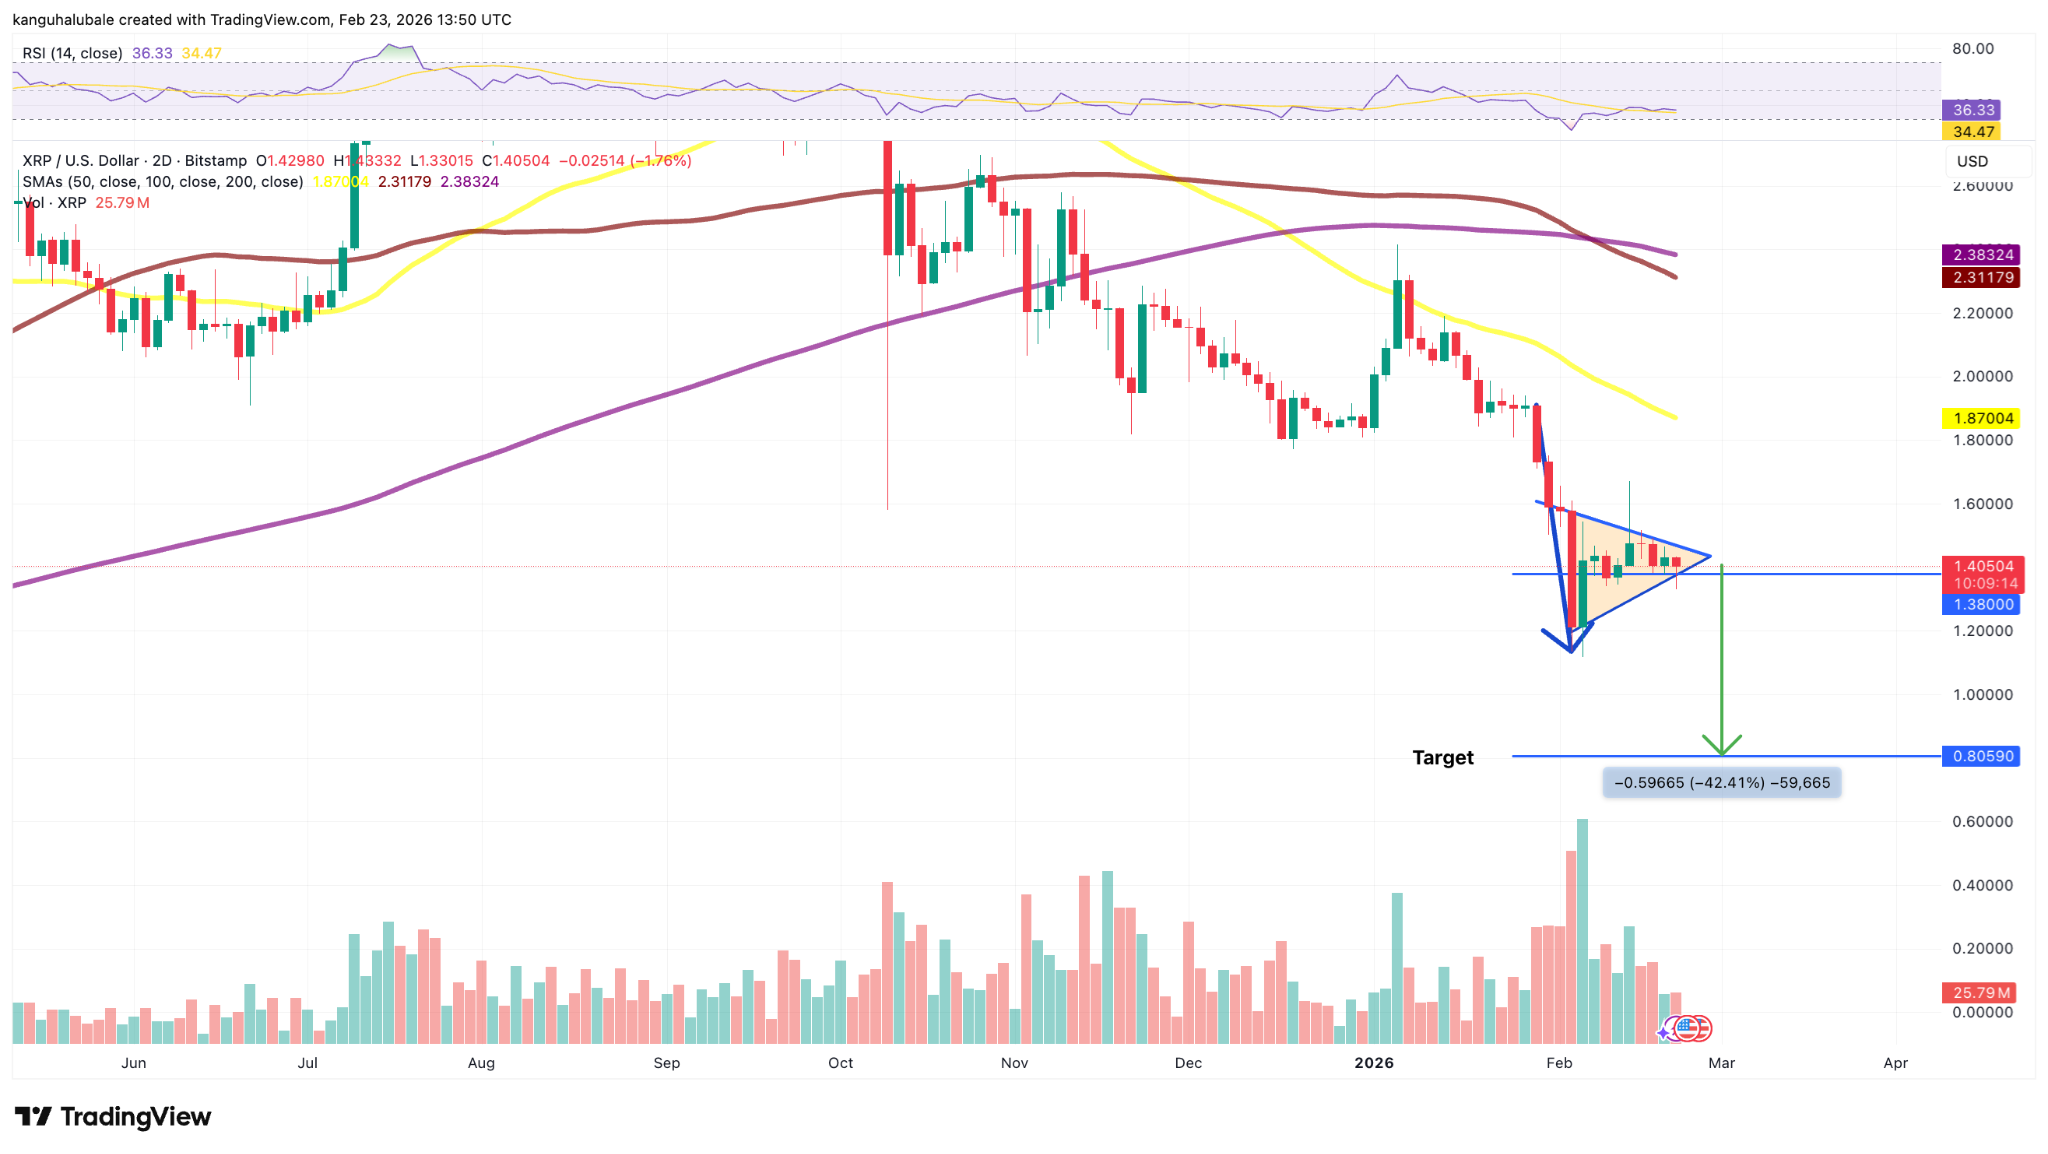
Should XRP confirm a breakdown from this pennant structure, market observers suggest the subsequent price objective could reach $0.80. Such a move would constitute approximately a 42% decline from present trading levels.
Market analyst BitGuru highlighted that $1.22 represents a crucial support threshold. According to his assessment, maintaining this level might enable a gradual price recovery, whereas a breach beneath $1.20 would likely validate bearish market dominance.

Large Holder Movements Intensify Distribution Concerns
February 21 witnessed over 31 million XRP tokens flowing into Binance exchange wallets. According to CryptoQuant analytics, this marked the most substantial single-day exchange deposit since January 20.
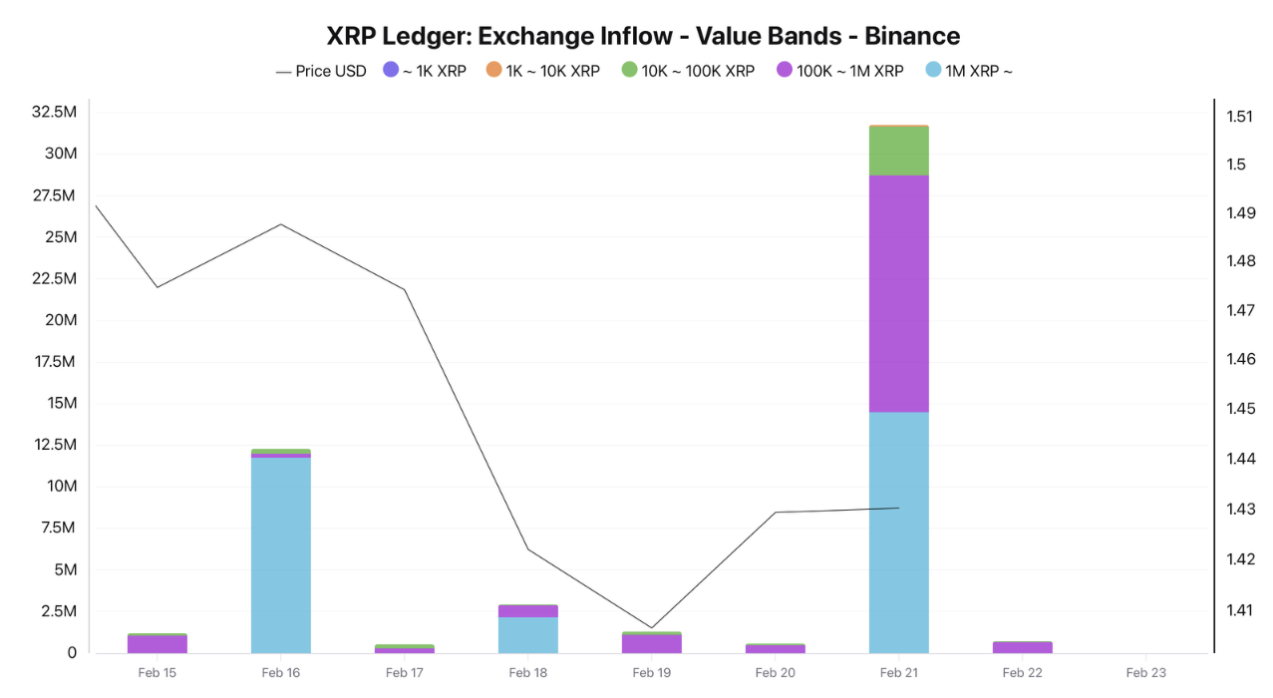
Major cryptocurrency holders were responsible for the bulk of this movement. Addresses containing more than 1 million XRP contributed 14.5 million tokens, while wallets holding between 100,000 and 1 million XRP added another 14.2 million.
CryptoQuant analyst Darkfost calculated the aggregate transfer represented approximately $45 million in prospective selling pressure. His assessment suggests that continued distribution activity could constrain XRP’s recovery prospects in the immediate term.
Examining the hourly chart, XRP encounters resistance barriers at $1.3650 and $1.3750. Reclaiming the $1.40 threshold would be necessary to reverse near-term bearish momentum.
Primary downside support establishes at $1.3275. Closing beneath $1.32 could expose further weakness toward $1.30, followed by $1.28.
Investment Product Flows Present Contrasting Signals
Despite ongoing price deterioration, XRP registered minor positive inflows during the previous week per CoinShares data. This occurred while cryptocurrency investment products overall hemorrhaged $288 million for the fifth straight week.
Bitcoin dominated outflows with $215 million in redemptions. Ethereum similarly experienced substantial withdrawals. XRP emerged as one of few digital assets continuing to attract new investment capital.
Investors based in the United States accounted for $347 million in aggregate crypto fund withdrawals. Conversely, European markets demonstrated different behavior, with Switzerland, Canada, and Germany collectively recording over $50 million in net inflows.
XRP’s market capitalization persists above $82 billion with approximately 61 billion tokens currently circulating.
Technical chartist EGRAG CRYPTO is monitoring the monthly 44 exponential moving average. His analysis suggests that closing beneath this indicator might catalyze a liquidity hunt toward the $0.65 to $0.85 zone. Conversely, defending this level could spark a counter-trend bounce targeting $2.20.
XRP most recently changed hands near $1.33, with the bear pennant pattern remaining unconfirmed on the two-day chart.
Get 3 Free Stock Ebooks
Discover top-performing stocks in AI, Crypto, and Technology with expert analysis.
- Top 10 AI Stocks - Leading AI companies
- Top 10 Crypto Stocks - Blockchain leaders
- Top 10 Tech Stocks - Tech giants


