

Key Takeaways
- XRP remains pressured near the $1.40 support zone as bearish signals intensify across the 4-hour timeframe
- Technical analysis reveals a descending triangle configuration with MACD indicating negative crossover
- The Relative Strength Index has declined to 40, reflecting diminished buying interest
- Institutional capital continues flowing into XRP ETFs, recording $15.74M–$25M in weekly entries
- Market observer Ali Charts suggests XRP may be positioning for significant movement, citing potential cycle low at $1.30
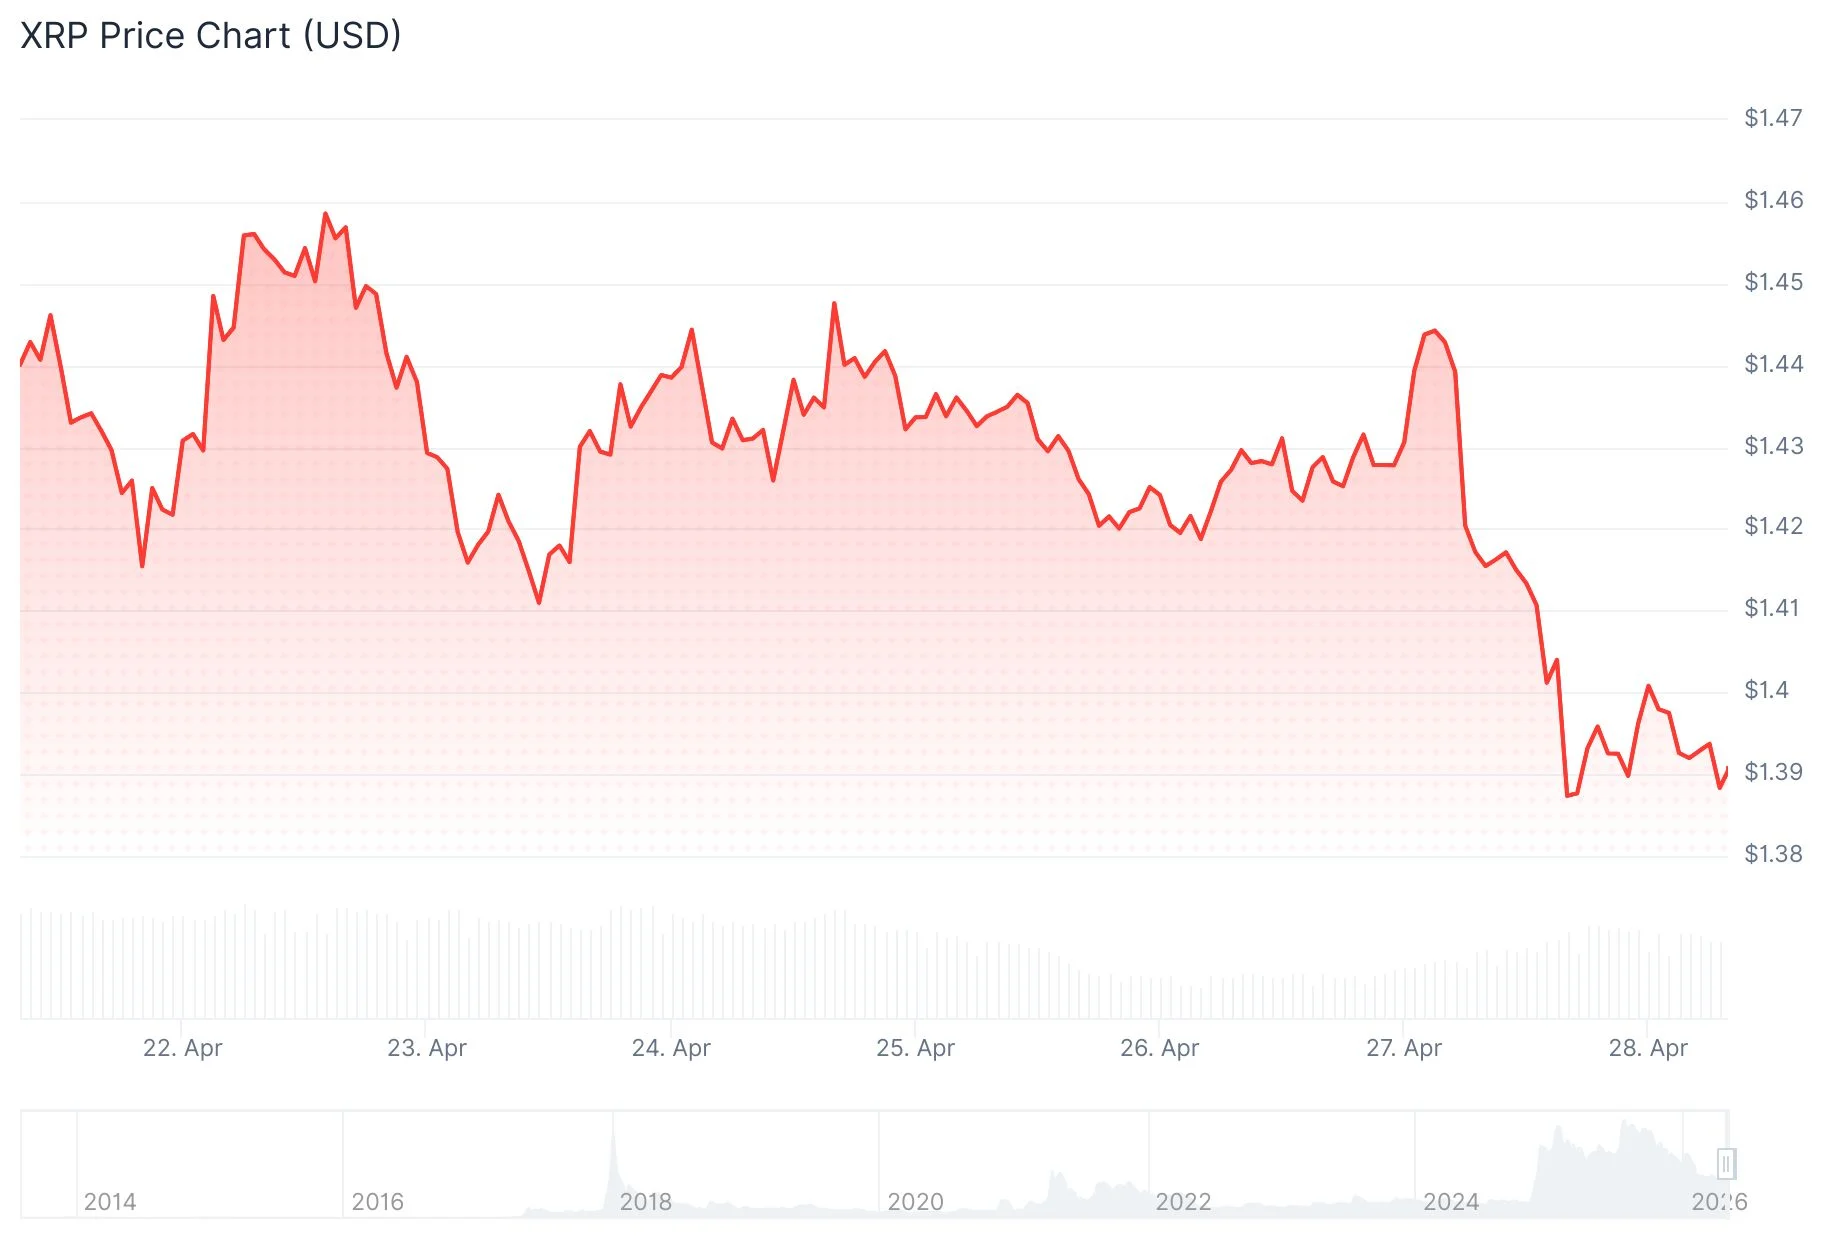
XRP maintains a precarious position around the $1.40 price point following its inability to sustain earlier weekly advances. Selling pressure has intensified as bearish forces dominate price action and momentum oscillators shift negative.
Technical analysis of the 4-hour timeframe reveals the development of a descending triangle configuration. This chart pattern consists of declining peaks converging toward a horizontal support baseline. Such formations typically forecast additional downward movement should the underlying support fail to hold.
The Moving Average Convergence Divergence indicator has completed a bearish crossover beneath its signal line. Expanding red histogram columns indicate accelerating downward momentum. Meanwhile, the RSI has retreated to approximately 40, signaling deteriorating buyer conviction.
The $1.40 threshold has endured multiple challenges throughout recent trading periods. Persistent pressure on support zones typically erodes their strength, elevating breakdown probability.
Should XRP breach the $1.40 floor, successive support layers exist at $1.38, followed by $1.36, with potential extension to $1.34 under sustained selling activity.

Critical Overhead Resistance Points
For bullish reversal, reclaiming $1.43 represents the initial hurdle. A more formidable obstacle awaits at $1.45, coinciding with the descending trendline boundary. Successful penetration above $1.45 would potentially unlock movement toward $1.50.
Over the trailing 30-day window, Bitcoin and Ethereum have appreciated 17% and 16% respectively. XRP has delivered merely 5% returns during this identical timeframe, demonstrating continued investor preference for established crypto assets.
Crypto analyst Ali Charts published on X platform that “$XRP is ready for a big price move,” while refraining from providing concrete price projections.
One market technician highlighted that XRP’s weekly RSI touched 30 during early March. Historical data shows that the three prior instances when RSI descended below 33 preceded rallies ranging from 226% to 1,460% in subsequent months.
Drawing from this historical precedent, FX Empire’s analytical team suggests the cyclical bottom may have already established itself at $1.30. Their outlook projects a potential advance to $1.50 as the near-term objective, subsequently targeting $1.65.
Institutional Interest Remains Strong in XRP ETFs
XRP-focused exchange-traded products accumulated between $15.74 million and $25 million throughout the previous week, with variance depending on reporting methodology. Cumulative year-to-date capital flows into XRP ETFs have now reached $148 million.
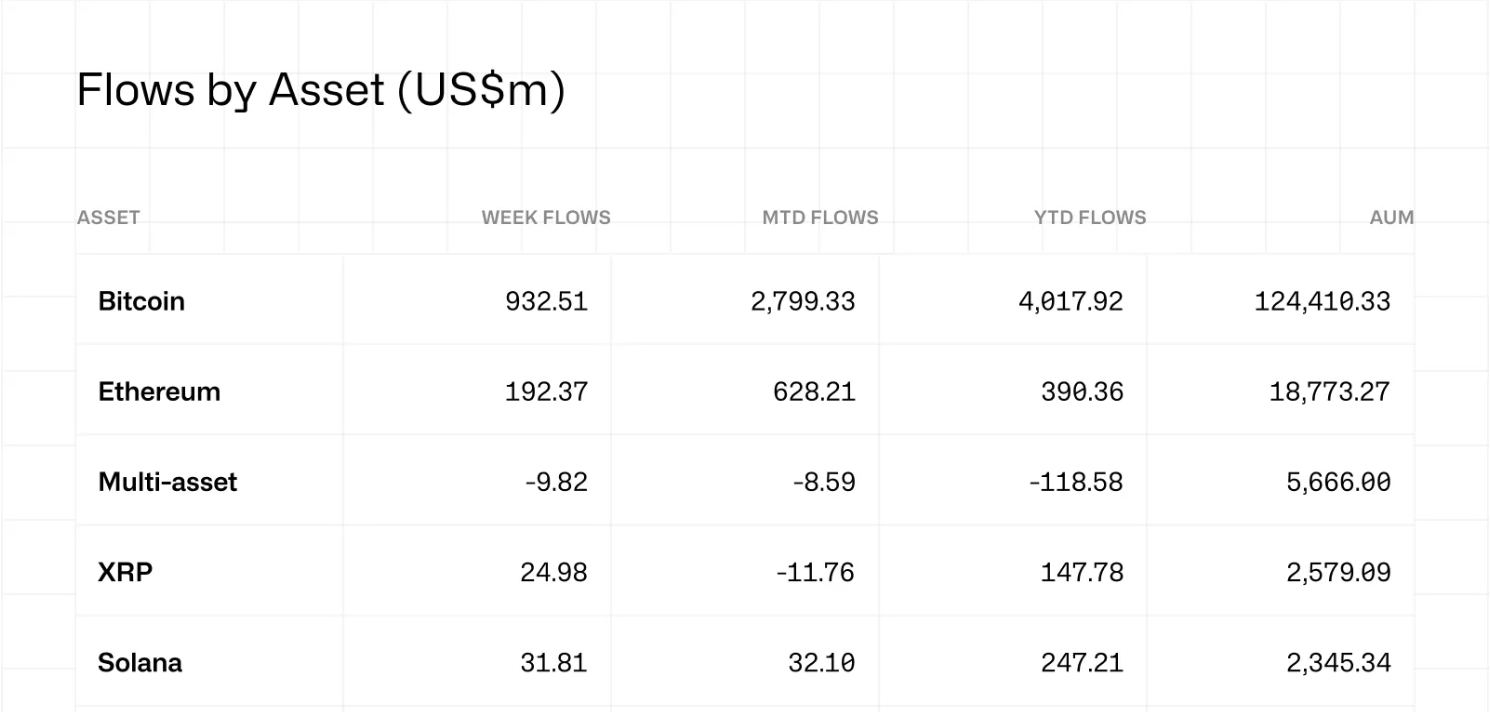
Bitcoin ETFs dominated cryptocurrency investment vehicles with $824 million in weekly allocations, extending their positive flow streak to four consecutive weeks. Ethereum ETFs captured $155 million in fresh capital, while Solana-based products attracted $9.44 million.
The comprehensive crypto ETP sector registered $1.2 billion in aggregate inflows during the previous week, per CoinShares data. The Crypto Fear and Greed Index presently registers 44, declining from its recent peak of 62.
The upcoming FOMC monetary policy meeting scheduled for April 28 commands significant market attention. Consensus expectations anticipate no adjustment to interest rates, with analysts projecting the absence of rate reductions throughout the remainder of the calendar year.
Get 3 Free Stock Ebooks
Discover top-performing stocks in AI, Crypto, and Technology with expert analysis.
- Top 10 AI Stocks - Leading AI companies
- Top 10 Crypto Stocks - Blockchain leaders
- Top 10 Tech Stocks - Tech giants


