

Key Takeaways
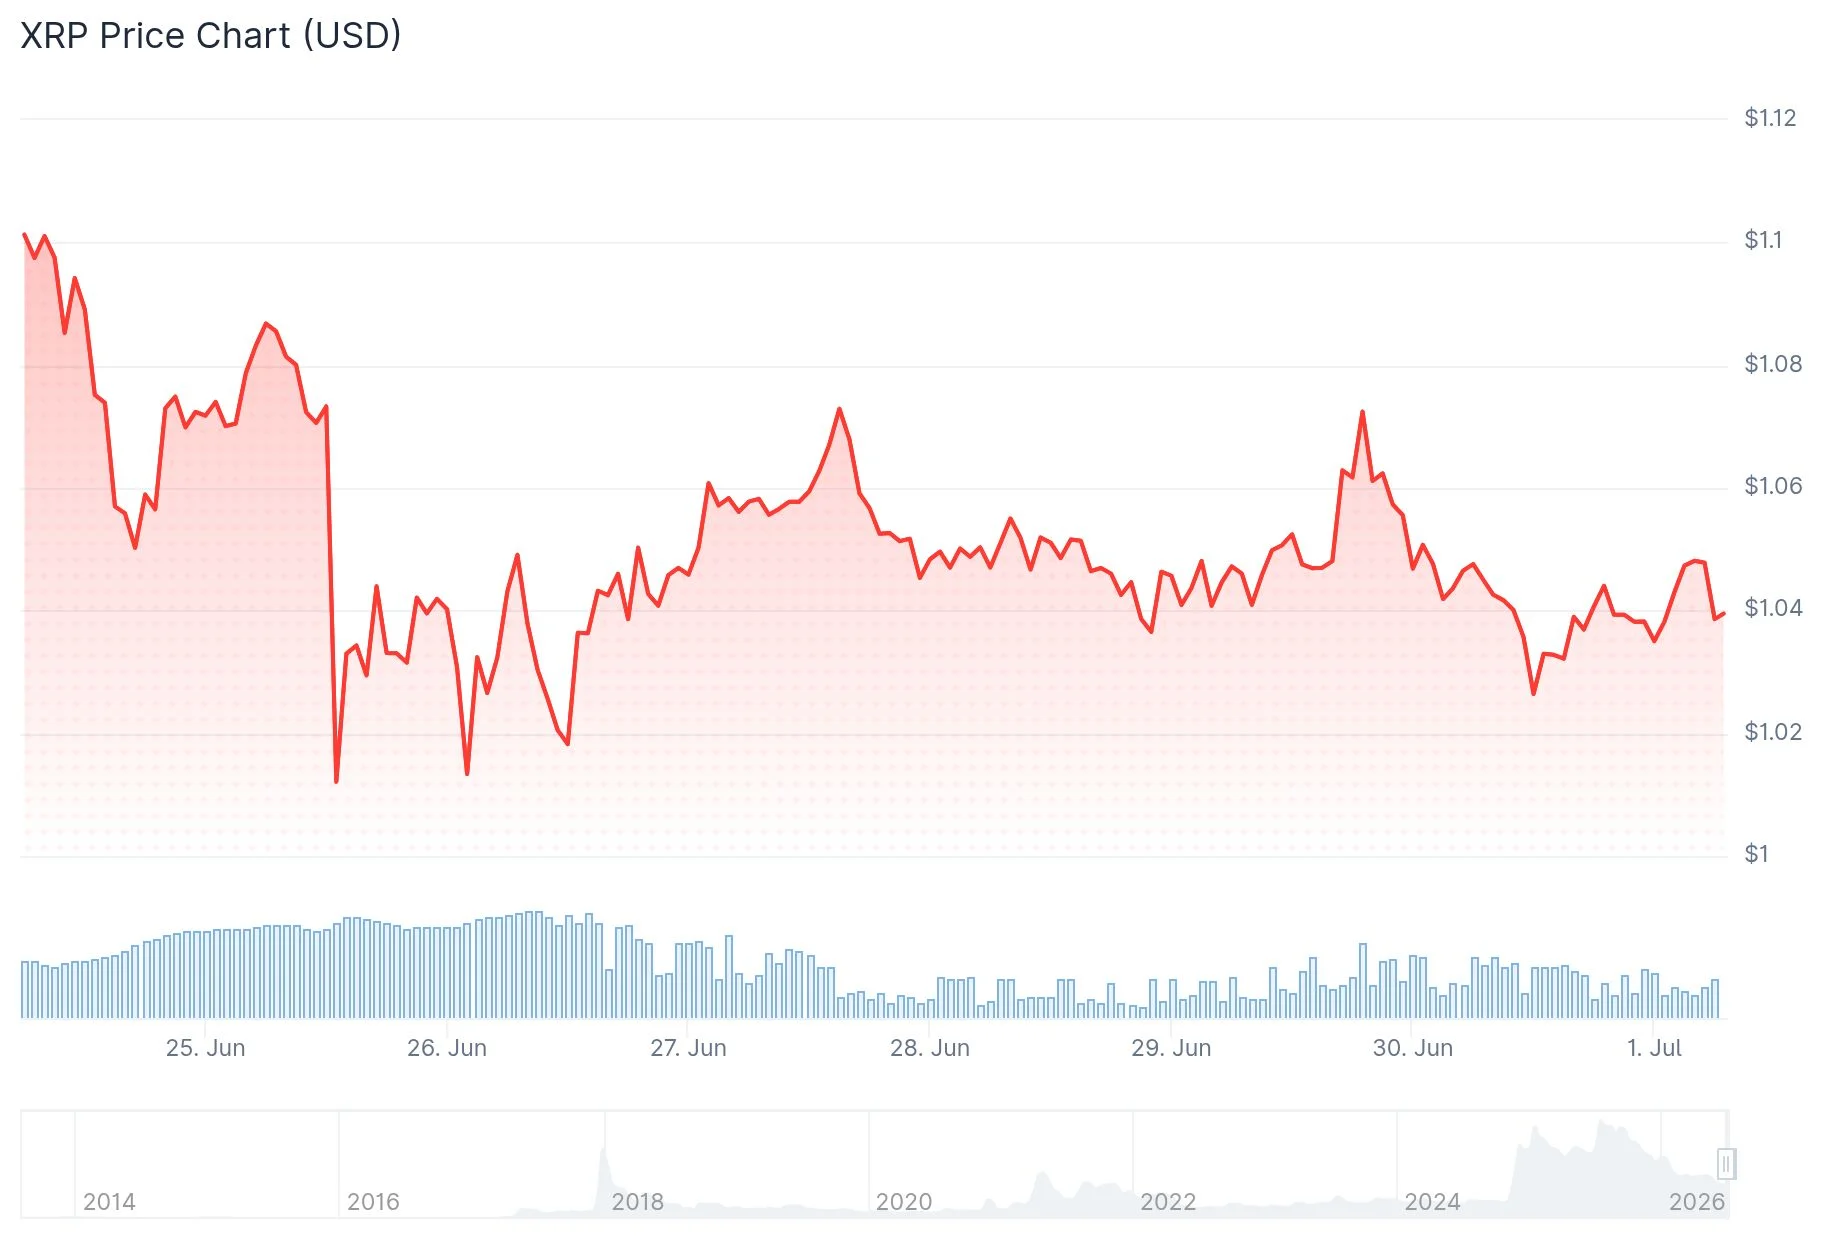
- XRP touched $1.009 on June 26, marking its nearest approach to the $1 threshold since November 2024
- Spot ETF inflows for XRP remained in positive territory despite downward price pressure
- Technical analysis reveals a sustained downtrend pattern extending from July 2025
- Open Interest metrics have leveled off around 400 million XRP, indicating reduced speculative fervor
- Daily chart patterns reveal bullish divergence, hinting at weakening downside momentum near the $1 mark
On June 26, 2026, XRP declined to $1.009, representing the token’s nearest encounter with the psychological $1 barrier since November 2024.
The decline occurred despite consistent capital inflows into XRP spot exchange-traded funds. Market participants continued accumulating these investment vehicles throughout the price decline.
While ETF accumulation reduces circulating XRP supply, this dynamic hasn’t generated upward price momentum under prevailing market circumstances.
Overall market appetite for XRP has weakened considerably in recent months, accompanied by diminishing speculative engagement.
Technical Analysis Overview
Chart analysis on the daily timeframe reveals XRP trapped in a downward trajectory originating from July 2025. The token’s February breach below the April 2025 swing low at $1.61 validated the bearish structure.

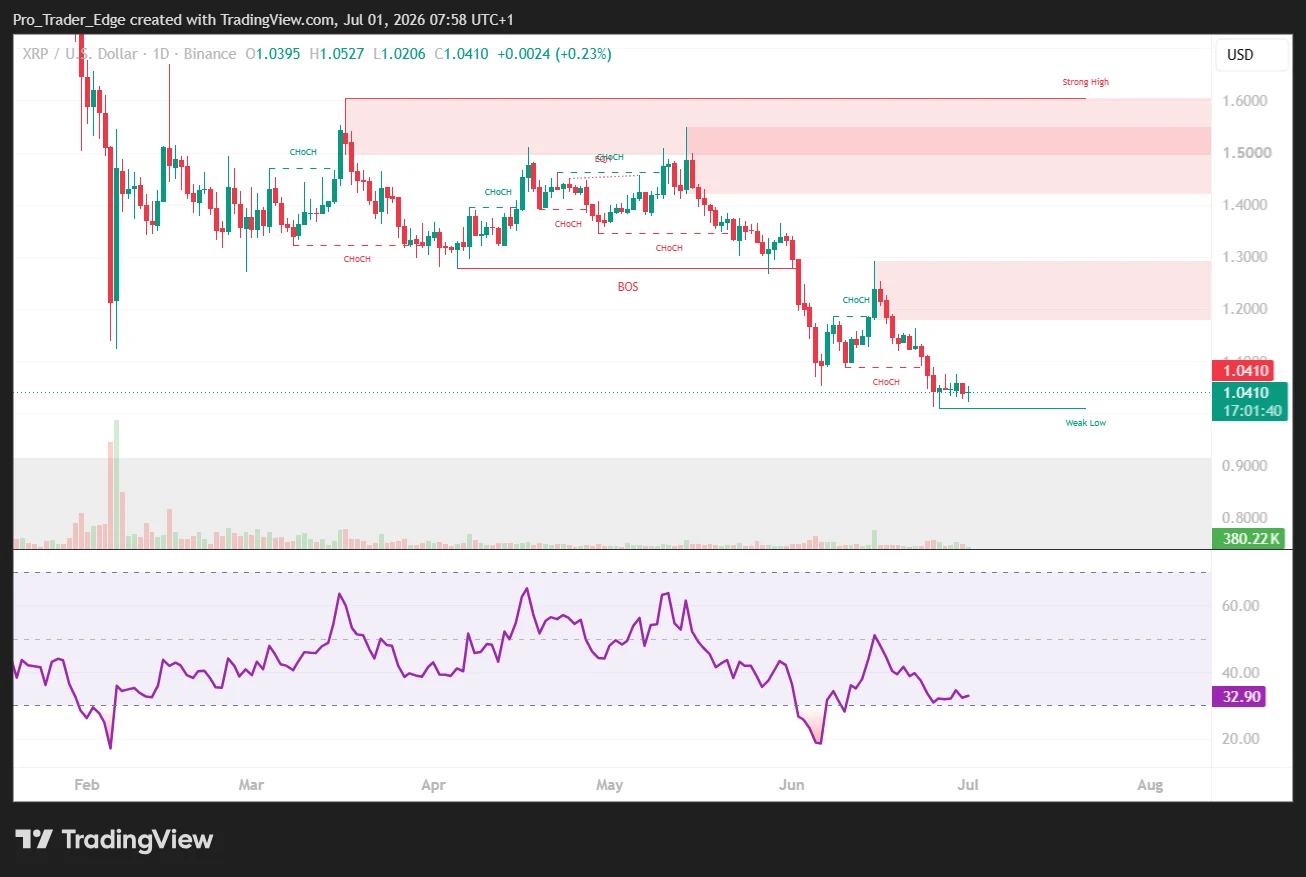
Following this breakdown, XRP consolidated within a defined range for multiple months. Late May witnessed an aggressive selloff that shattered this consolidation zone, driving prices substantially lower.
A temporary recovery pushed XRP toward $1.30 before reversing course to settle around $1.05.
Derivatives market data indicates Open Interest stabilizing at approximately 400 million XRP. Meanwhile, the Open Interest Turnover Ratio has maintained levels near 0.71.
Market analyst Arab Chain emphasized monitoring these metrics for sudden changes. Sharp increases in either Open Interest or turnover ratio typically precede heightened volatility episodes.
Examining the 4-hour timeframe, XRP rallied to $1.2935 during mid-June. This advance reached the 78.6% Fibonacci retracement zone near $1.2985 before encountering renewed selling pressure.
Bearish continuation targets are positioned at $0.975 and $0.854 should downward momentum persist. Most analysts considered a July breakdown below $1 the higher probability outcome.
Potential Support Indicators
An alternative technical perspective reveals different possibilities. XRP has repeatedly found buyers within the $0.90 to $1.00 zone, establishing this area as a validated support region through multiple tests.
The $1.13 level has transitioned from previous support into current resistance. Successfully recapturing this threshold would indicate strengthening bullish momentum.
A bullish divergence formation on the daily chart has persisted for approximately one week. Such patterns frequently indicate diminishing selling conviction rather than imminent collapse.
On social platforms, trader Celal Kucuker stated XRP should maintain current support levels and potentially climb to $10 within twelve months, though acknowledging significant volatility along the way.
Technical analyst ChartNerd identified a repetitive accumulation structure observed during previous bear cycles, highlighting historical drawdowns ranging from 85% to 96% spanning 14 to 37 months, contrasted with the present 72% correction across 11 months.
Ultimately, the $1.00 level represents the critical line in the sand. Defending this support maintains the possibility of retesting $1.13 resistance, while failure below it exposes the $0.87 to $0.90 downside zone.
Get 3 Free Stock Ebooks
Discover top-performing stocks in AI, Crypto, and Technology with expert analysis.
- Top 10 AI Stocks - Leading AI companies
- Top 10 Crypto Stocks - Blockchain leaders
- Top 10 Tech Stocks - Tech giants


