

Key Takeaways
- A 9-year ascending triangle pattern on XRP’s monthly chart points to a potential $8.50 price target, according to analyst Ali Martinez
- Critical support level identified between $0.75–$0.80, marked as an optimal accumulation zone
- Binance data reveals Taker Buy/Sell ratio reaching all-time highs, indicating increased buying activity
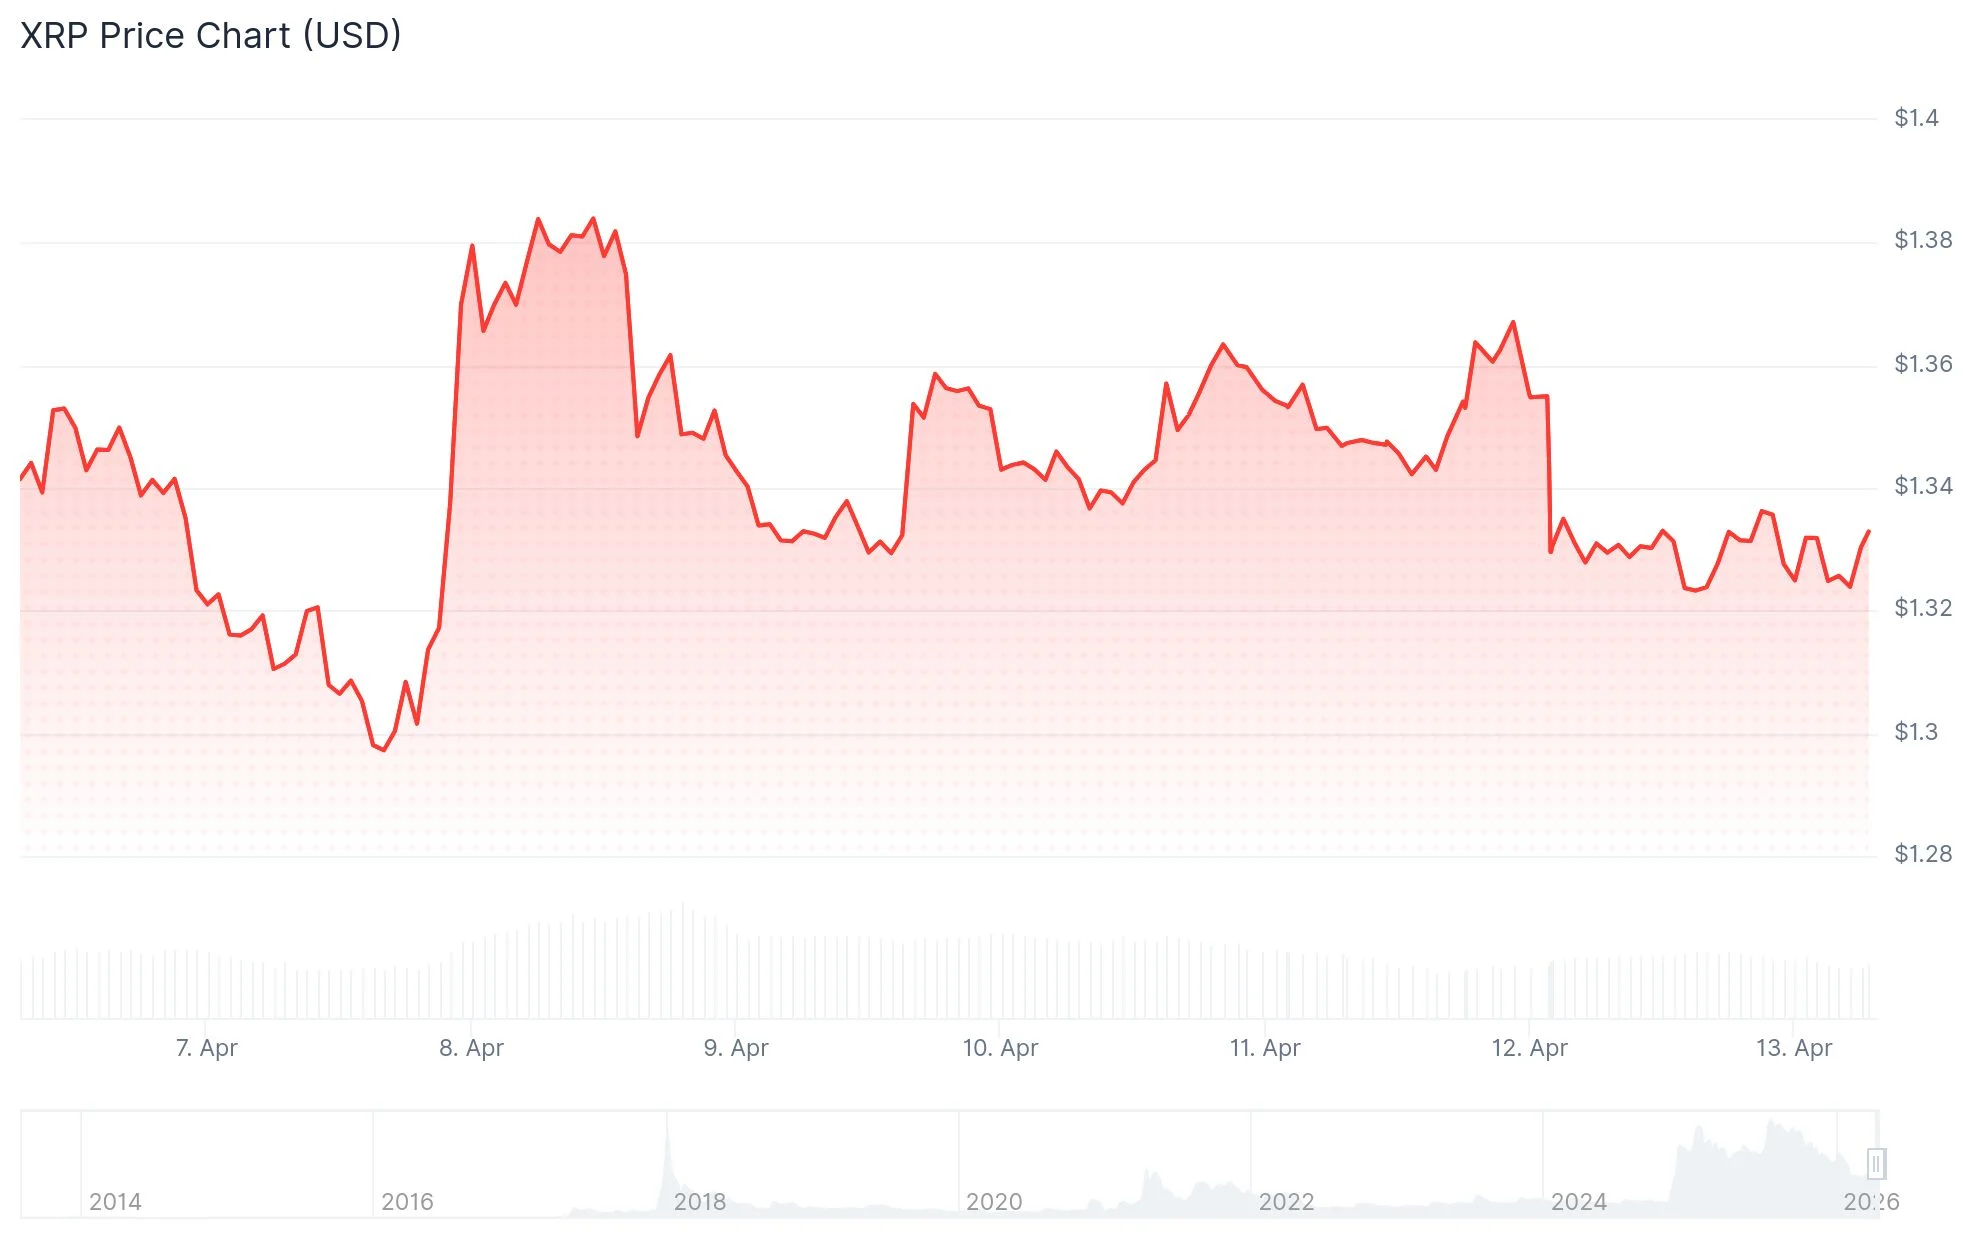
- XRP currently hovers around $1.33, showing a 1.7% decline over 24 hours but maintaining a 2.36% weekly gain
- Futures open interest declined 1.76% to $2.43 billion, accompanied by $3.98M in liquidations predominantly affecting long positions
XRP maintains its position near $1.33 while market observers monitor a significant technical formation that has developed over nearly a decade. The digital asset remains confined within a tight trading band, awaiting a decisive directional catalyst.
Cryptocurrency technical analyst Ali Martinez shared insights on X, highlighting that XRP has been developing a substantial ascending triangle formation since 2017. Throughout this period, XRP has consistently encountered resistance at the upper boundary before retreating to an ascending support trendline. This cyclical behavior has occurred numerous times.
The chart analysis from Martinez reveals horizontal resistance positioned around $3.30, a level where prior bullish attempts have faltered. Meanwhile, the ascending support trendline has steadily climbed higher throughout the years, with both lines now converging toward their apex — traditionally the zone where decisive breakouts materialize.
Should a breakout materialize, Martinez projects a price objective of $8.50. This target represents an approximate 530% appreciation from present price levels.
Critical Support Territory Between $0.75–$0.80
The latest rejection from the resistance boundary occurred in August 2025. Following this price action, Martinez highlighted the $0.75–$0.80 zone as a critical area for market participants. He characterized this level as the “ultimate buy the dip opportunity” before the triangle pattern approaches its conclusion.

Separately, analyst Crypto TXG observed that XRP remains confined within a more immediate consolidation channel spanning $1.61 to $1.82. No decisive directional candles have emerged, and a breakout from this compression zone is required before establishing the next trend phase.
Blockchain Metrics Indicate Growing Demand
Analyst CryptoOnchain highlighted notable movements in Binance’s Taker Buy/Sell ratio. The 100-day moving average recently established an all-time peak. The 30-day measurement reached 0.495 for buyers, whereas the corresponding sell ratio decreased to 0.505.
This dynamic indicates that an increasing number of market participants are executing aggressive buy orders, while selling pressure diminishes. The data suggests steady accumulation occurring beneath the surface.
U.S.-listed spot XRP ETFs recorded $11.5 million in net positive flows over the past week, although certain trading sessions registered zero movement.
Santiment highlighted that negative sentiment surrounding XRP on social platforms has reached its third-highest concentration in two years. The analytics platform emphasized that historically, when bearish commentary reaches such extremes, price action frequently moves counter to prevailing sentiment.
Futures open interest contracted 1.76% to $2.43 billion. Liquidation figures revealed $3.98 million eliminated within a 24-hour window, with $3.35 million originating from long positions — evidence of ongoing near-term pressure confronting bullish speculators.
Get 3 Free Stock Ebooks
Discover top-performing stocks in AI, Crypto, and Technology with expert analysis.
- Top 10 AI Stocks - Leading AI companies
- Top 10 Crypto Stocks - Blockchain leaders
- Top 10 Tech Stocks - Tech giants


