

Key Takeaways
- XRP is exhibiting a chart formation identical to 2025’s pattern that generated 66% appreciation to $3.66
- Technical analysts are closely monitoring the bull flag breakout level above $1.40
- Daily chart symmetrical triangle formation suggests potential advance toward $1.90, followed by $2
- Spot taker cumulative volume delta turned positive May 1, indicating buyer dominance
- Open interest delta registered +$27 million on May 1, signaling new derivatives activity
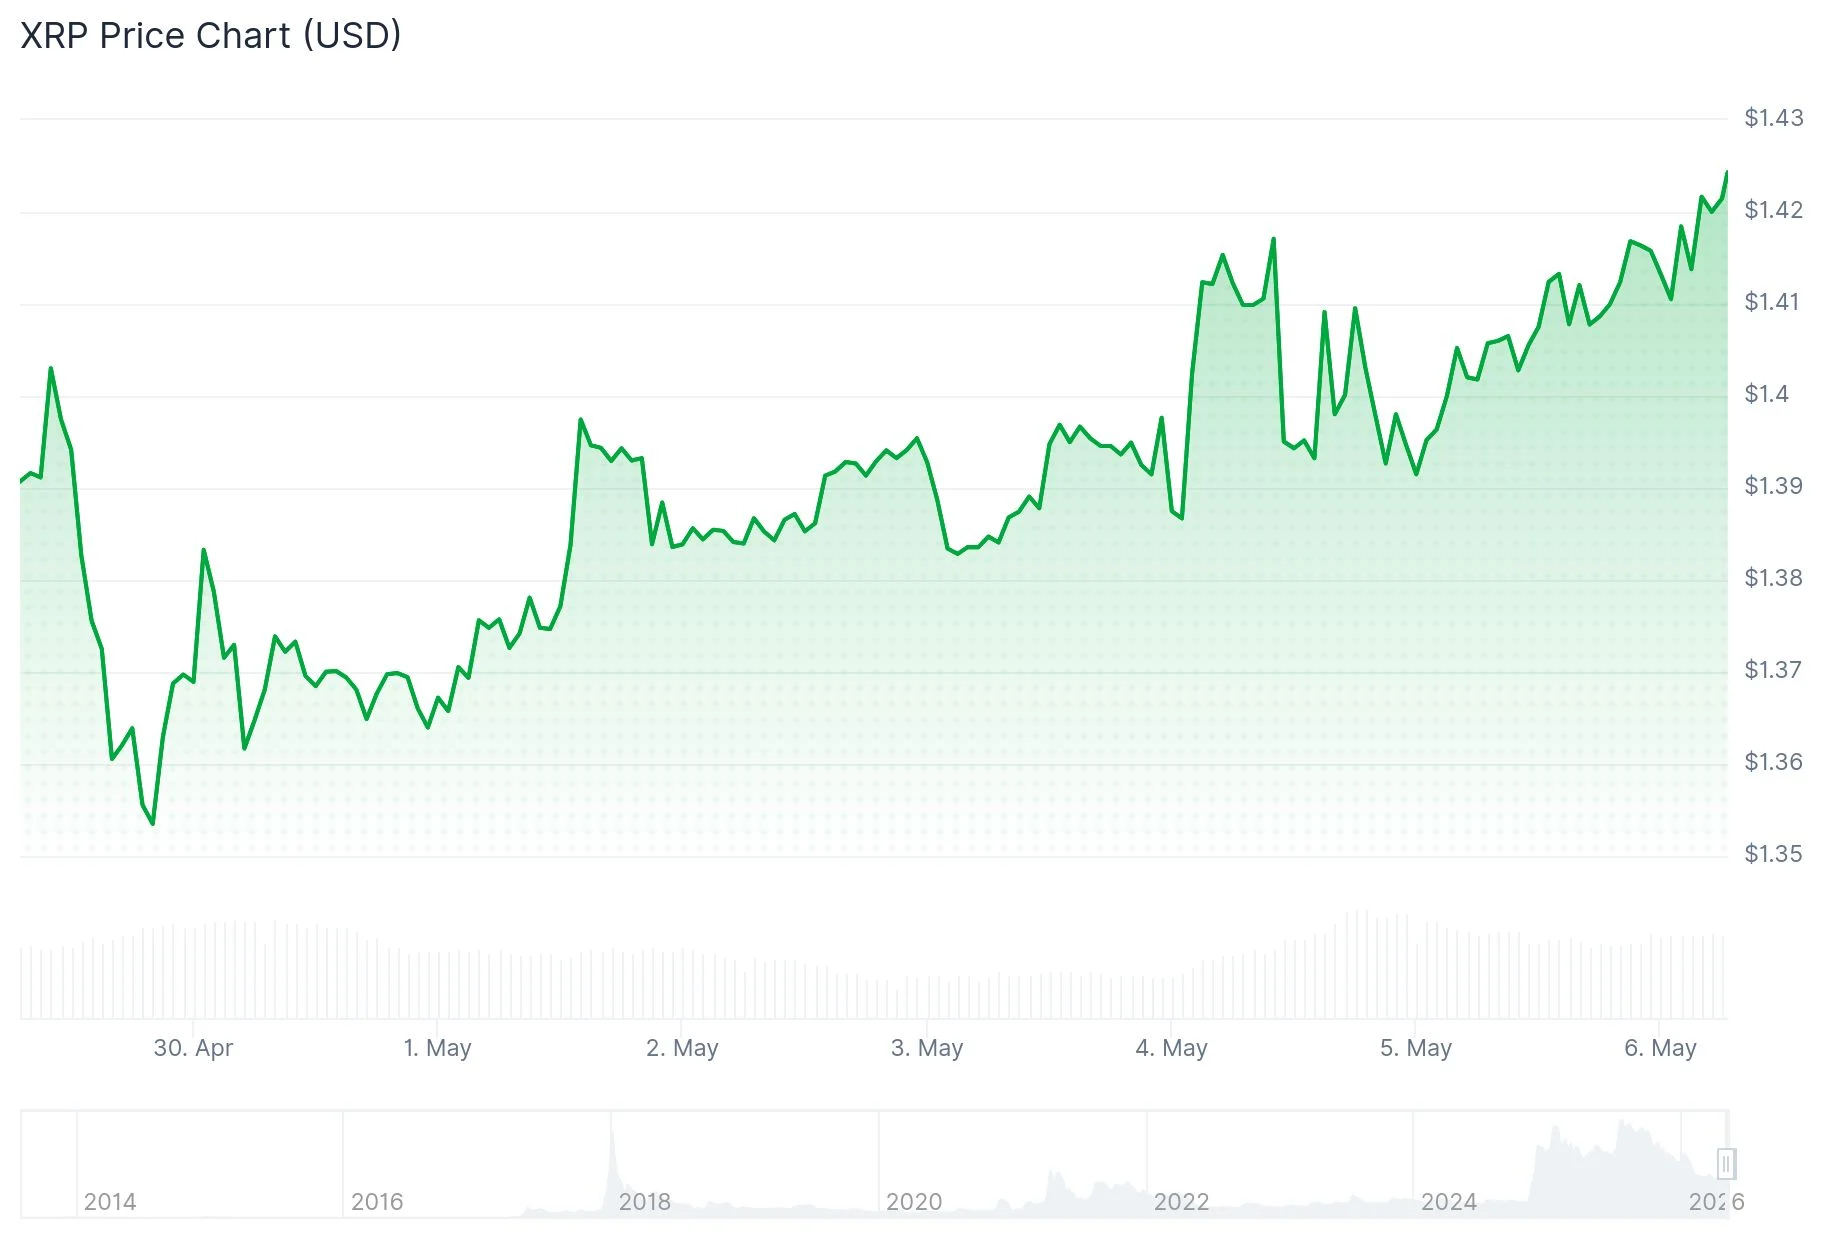
XRP is currently exchanging hands around $1.39–$1.41 in early May 2026, stabilizing following tests of near-term resistance levels. The current price behavior has captured analyst focus due to parallels with a technical formation that materialized in mid-2025.
The 2025 configuration — characterized by a bull flag formation coupled with a positive EMA crossover — produced a 66% advance within a fourteen-day window, elevating XRP from approximately $2.21 to its present all-time peak of $3.66.
The current technical landscape is replicating this scenario. XRP has completed a breakout from a comparable bull flag structure, while the 20-day and 50-day exponential moving averages are approaching a constructive crossover point.
Market analyst Jack Straw observed on Tuesday that XRP is “building strength above the $1.40 threshold, maintaining position above its 100-hour simple moving average,” further stating that “a decisive push past $1.420 may catalyze the subsequent upward movement.” Fellow analyst Sam Mti similarly identified a purchase signal from the MTI indicator, describing the formation as “appearing favorable” with capacity to achieve $1.45 provided $1.40 support remains intact.
Should the 66% fractal pattern replicate from present price levels, a theoretical objective near $2.35 emerges.
Purchasing Activity Resurges as CVD Turns Positive
Among the most compelling data supporting the constructive outlook is XRP’s 90-day spot taker cumulative volume delta (CVD). This indicator calculates the net difference between purchasing and selling volume across a three-month period.

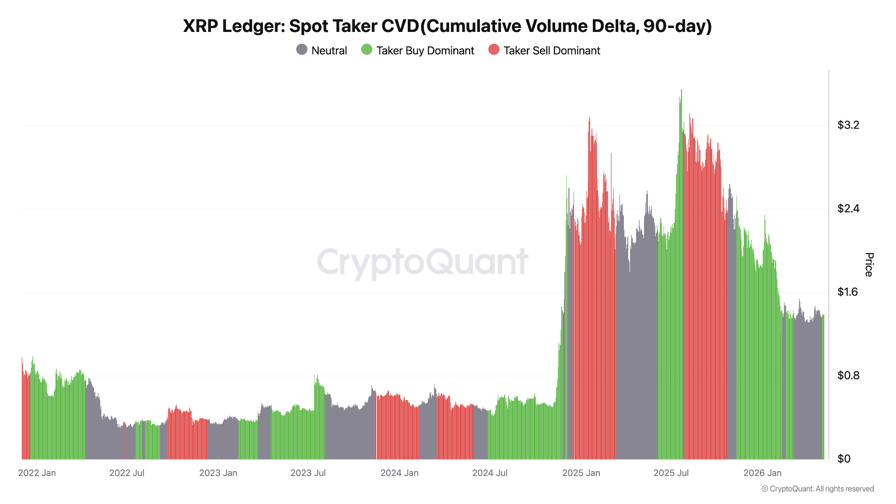
This metric reversed to positive territory on May 1, coinciding with XRP‘s climb beyond the $1.38 resistance zone. A comparable CVD reversal occurred in June 2025 and subsequently preceded 70% price appreciation.
CryptoQuant analyst Amr Taha identified a pronounced positive spike in open interest delta, which reached $27 million on May 1. “When this phenomenon occurs concurrent with price advancement, it frequently indicates that market participants are expanding positions as upward momentum starts rebuilding,” Taha explained.
Triangle Configuration Suggests $1.90 Objective
On the daily timeframe, an additional symmetrical triangle formation is taking shape. Within this technical structure, two converging trend boundaries compress price movement until a directional breakout materializes.
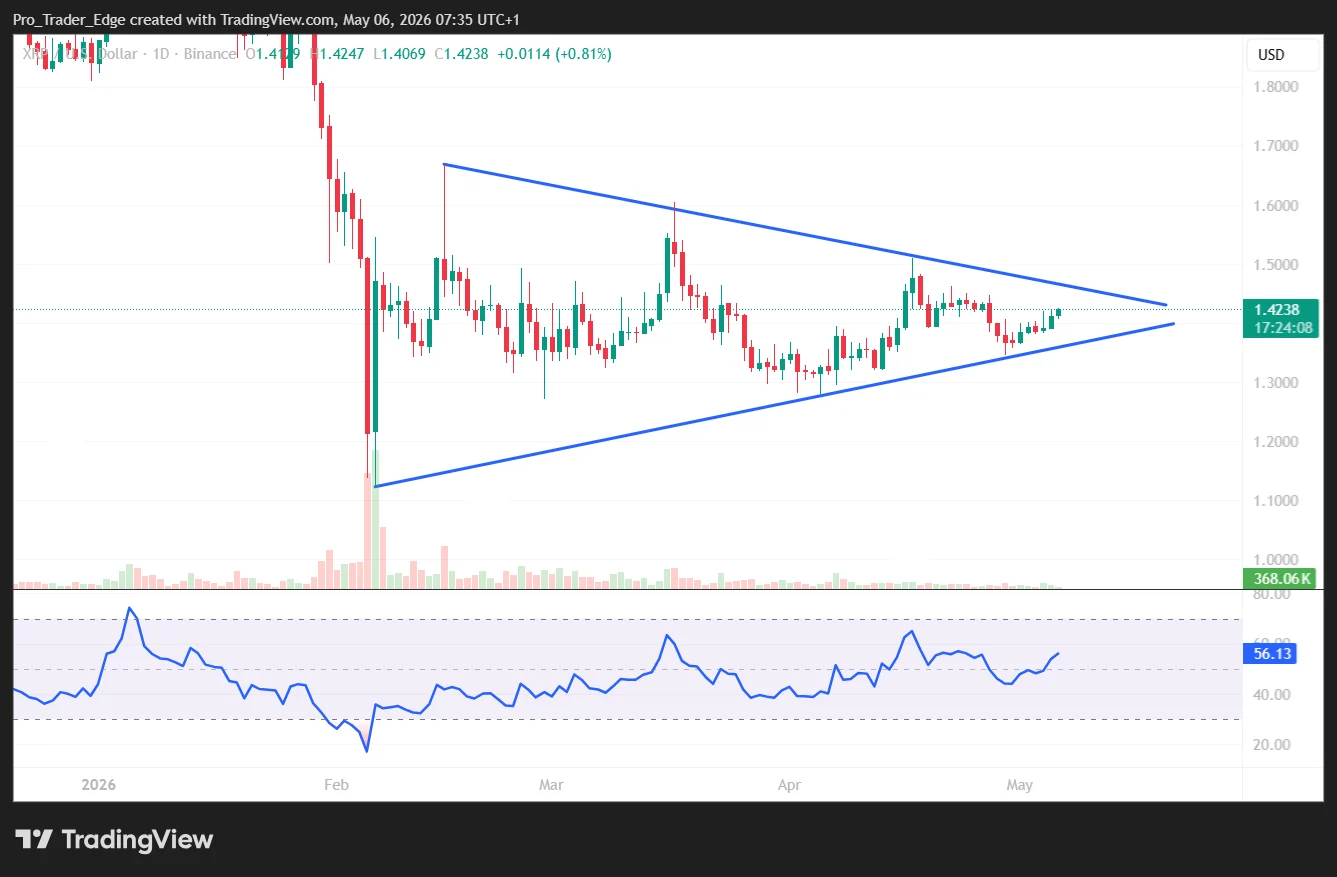
A validated advance beyond $1.45 would authenticate this pattern and establish a measured move target approaching $1.90 — a projection calculated from the triangle’s vertical dimension. Subsequently, the $2 psychological threshold represents the following major resistance zone.
Momentum measurements are also aligning favorably. The Supertrend indicator has transitioned to green, suggesting a trend reversal. The MACD is approaching a bullish intersection, which upon confirmation, would supply additional support for upside potential.
Price must sustain levels above $1.40 — representing both the bull flag’s upper limit and the 50-day simple moving average — for this technical thesis to remain valid.
Get 3 Free Stock Ebooks
Discover top-performing stocks in AI, Crypto, and Technology with expert analysis.
- Top 10 AI Stocks - Leading AI companies
- Top 10 Crypto Stocks - Blockchain leaders
- Top 10 Tech Stocks - Tech giants


