

Key Takeaways
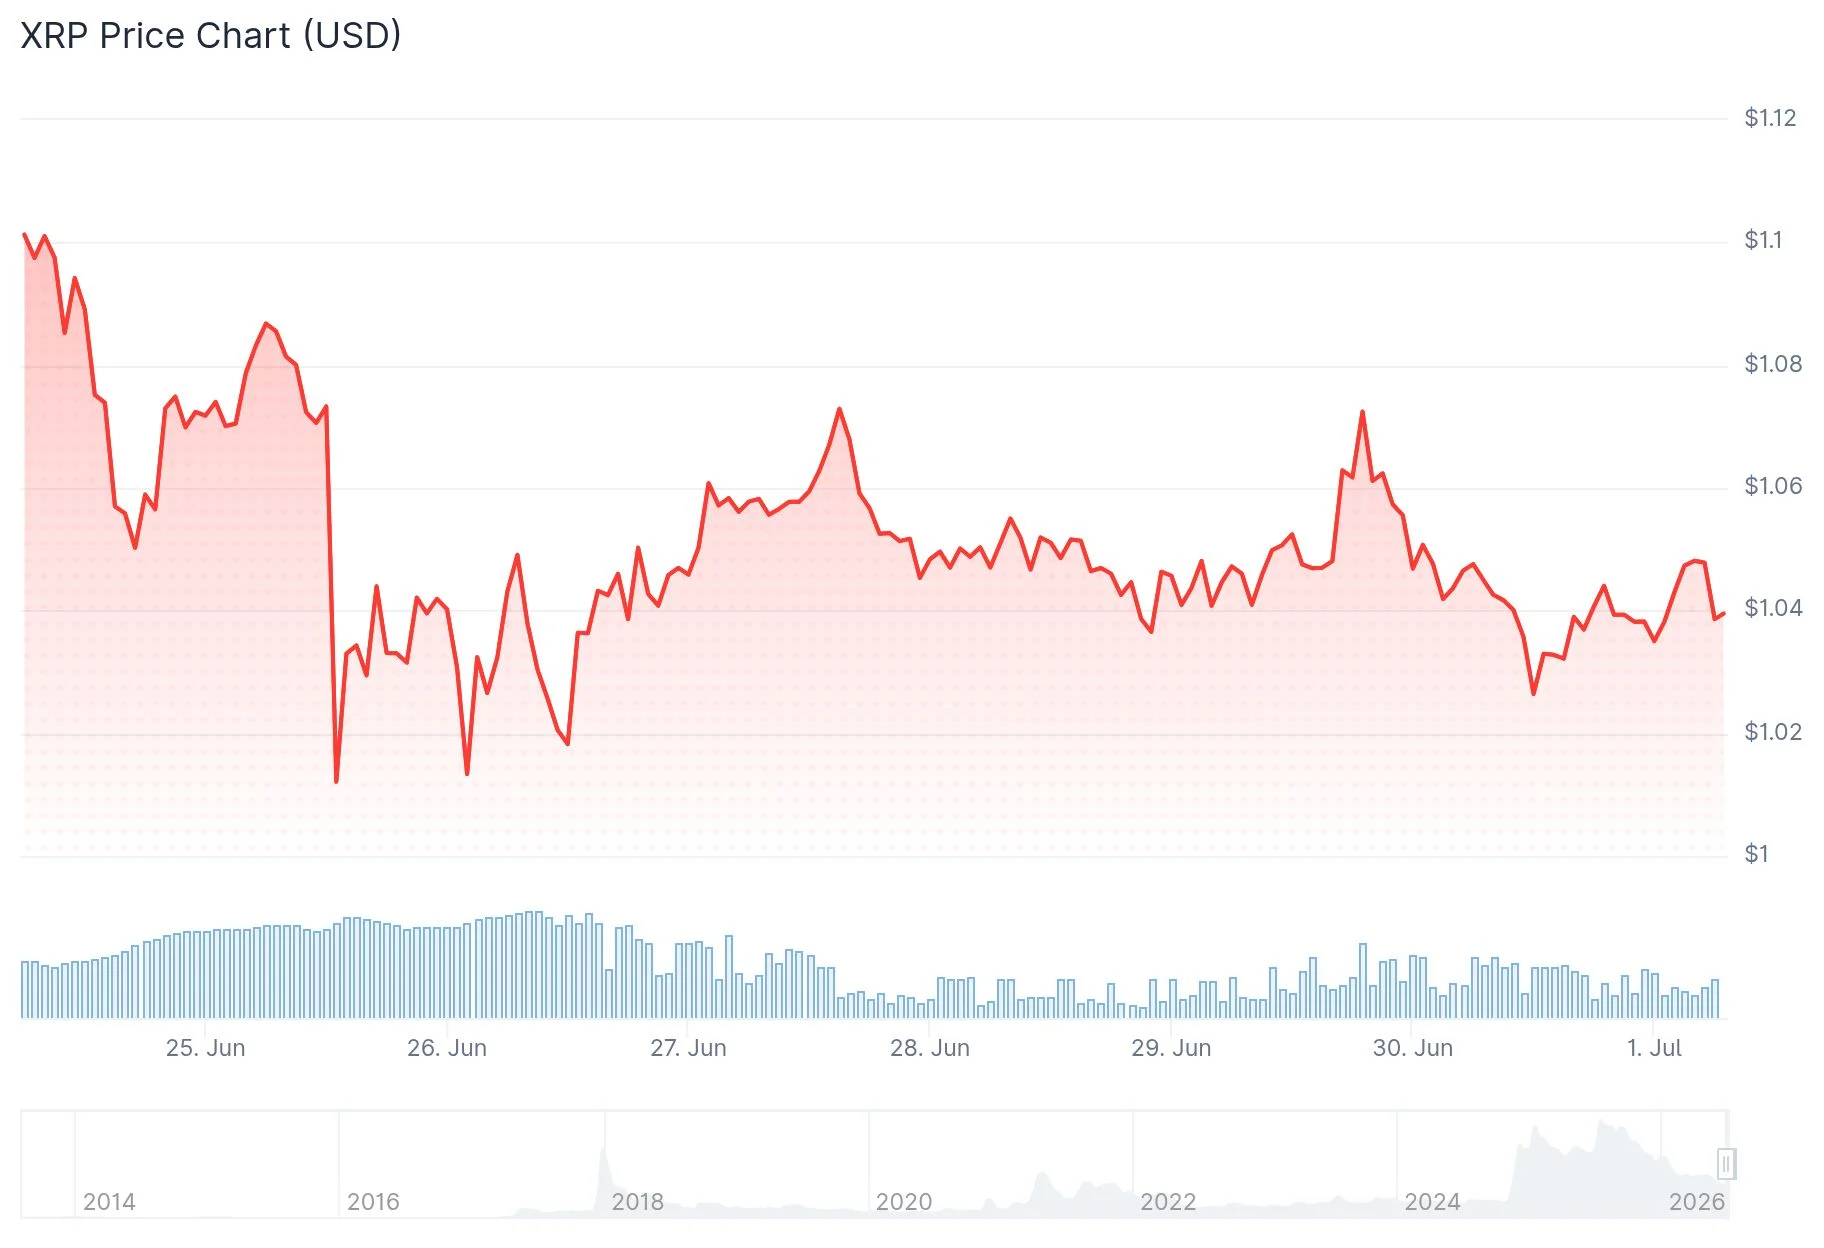
- XRP touched $1.009 on June 26, marking its nearest approach to $1 since November 2024
- Despite price weakness, XRP spot ETF products maintained consistent positive inflows
- Technical analysis reveals a persistent downtrend originating from July 2025
- Derivatives Open Interest has found equilibrium around 400 million XRP, indicating reduced speculative fervor
- Daily chart patterns display bullish divergence, hinting at potential exhaustion of bearish momentum near $1
On June 26, 2026, XRP declined to $1.009, representing its tightest encounter with the psychologically significant $1 threshold since November 2024.
This descent occurred despite continuous capital inflows into XRP spot exchange-traded funds. Market participants expanded their ETF positions throughout the price decline.
While ETF accumulation theoretically reduces circulating supply, this dynamic has failed to generate upward price momentum amid prevailing market conditions.
Overall market appetite for XRP has weakened considerably over recent months, accompanied by declining speculative engagement.
Technical Analysis Overview
The daily timeframe reveals XRP locked in a descending trend that originated in July 2025. The token’s February breach below the April 2025 swing low of $1.61 validated the bearish structure.

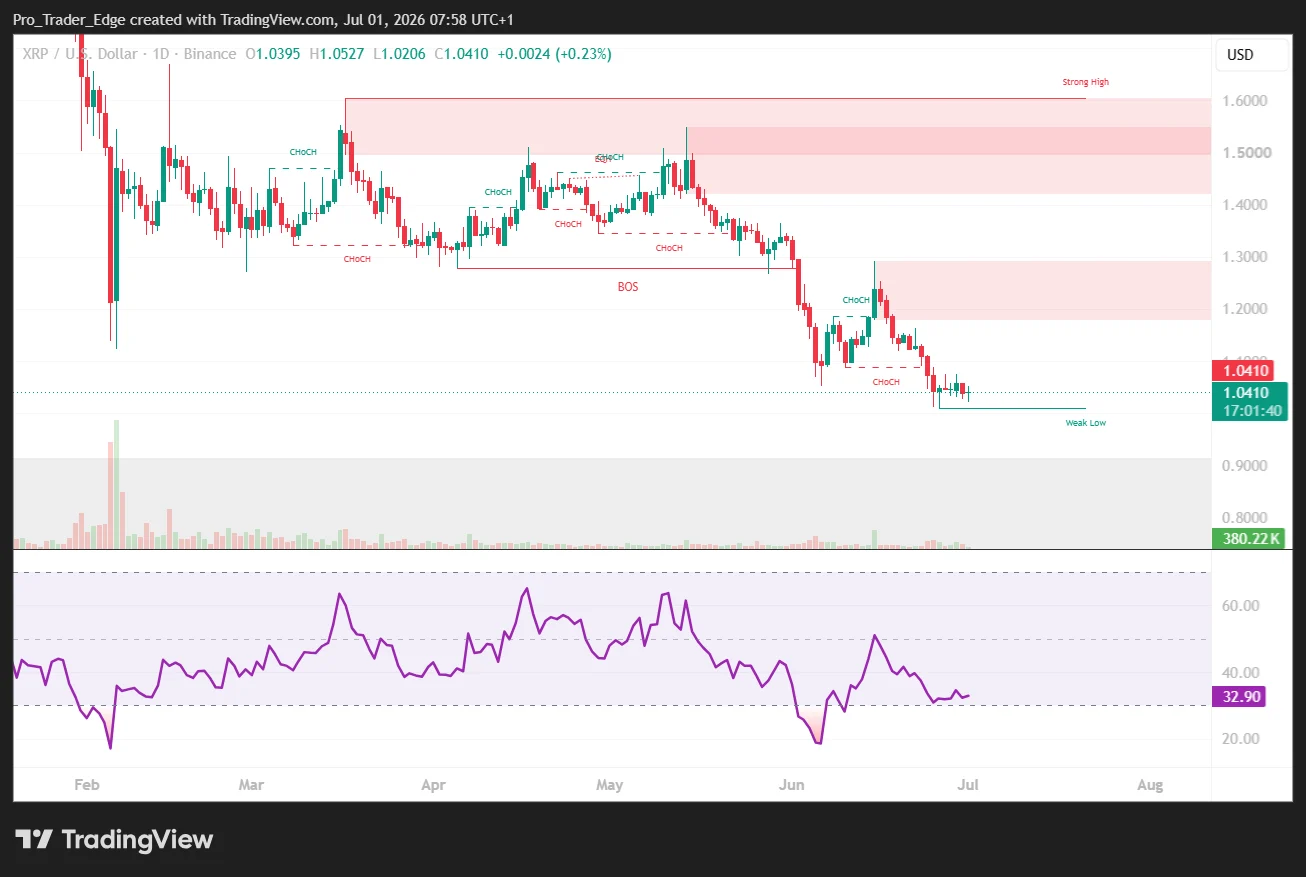
Following this breakdown, XRP consolidated within a defined range for multiple months. Late May witnessed an aggressive selloff that shattered this consolidation zone, driving prices significantly lower.
A temporary recovery pushed XRP toward $1.30 before renewed selling pressure forced a retreat to the $1.05 vicinity.
Derivatives market data indicates Open Interest stabilizing around the 400 million XRP mark. The Open Interest Turnover Ratio has maintained levels near 0.71.
Market analyst Arab Chain emphasized monitoring these metrics for sudden spikes. Abrupt increases in either Open Interest or turnover ratio typically precede heightened volatility episodes.
Examining the 4-hour timeframe, XRP rallied to $1.2935 during mid-June. This advance reached the 78.6% Fibonacci retracement zone near $1.2985 before encountering resistance and reversing.
Bearish continuation scenarios point toward downside objectives at $0.975 and $0.854. Market observers considered a July breach below $1 more probable than a sustained recovery.
Bullish Counterarguments Emerge
Alternative technical interpretations present a contrasting perspective. XRP has repeatedly rebounded from the $0.90-$1.00 support corridor, which has withstood multiple challenge attempts.
The $1.13 level has transformed from previous support into current resistance. A successful reclamation of this threshold would indicate renewed bullish momentum.
A bullish divergence pattern on the daily chart has persisted for approximately one week. Such formations frequently signal diminishing bearish pressure rather than imminent sharp declines.
Trader Celal Kucuker expressed confidence on social platforms that XRP would maintain current support structures and potentially surge to $10 within the next twelve months, acknowledging significant volatility along the journey.
Technical analyst ChartNerd identified a repeating accumulation configuration observed during previous bear market cycles, highlighting historical drawdowns ranging from 85% to 96% spanning 14 to 37 months, contrasted with the present 72% retracement over 11 months.
The $1.00 level remains the critical battleground. Sustaining above this support maintains possibilities for retesting $1.13 resistance, whereas failure exposes the $0.87-$0.90 zone as the next defensive area.
Get 3 Free Stock Ebooks
Discover top-performing stocks in AI, Crypto, and Technology with expert analysis.
- Top 10 AI Stocks - Leading AI companies
- Top 10 Crypto Stocks - Blockchain leaders
- Top 10 Tech Stocks - Tech giants


