
 Price: Trading Data Shows Shift in Market Sentiment")
TLDR
- TRON (TRX) is trading around $0.269 after pulling back from a local high near $0.282
- The token faces resistance at $0.274-$0.285 range with mixed signals on breakout potential
- On-chain metrics show strength with 8 million transactions and $25 million transfer volume in 24 hours
- Technical analysis suggests either consolidation or potential move toward $0.32-$0.34 if resistance breaks
- Liquidation data shows possible downside to $0.255 or upside hunt to $0.282
TRON has been trading in a tight range around $0.269, showing stability while other cryptocurrencies face market turbulence. The token recently pulled back from local highs near $0.282 but maintains its position above key support levels.
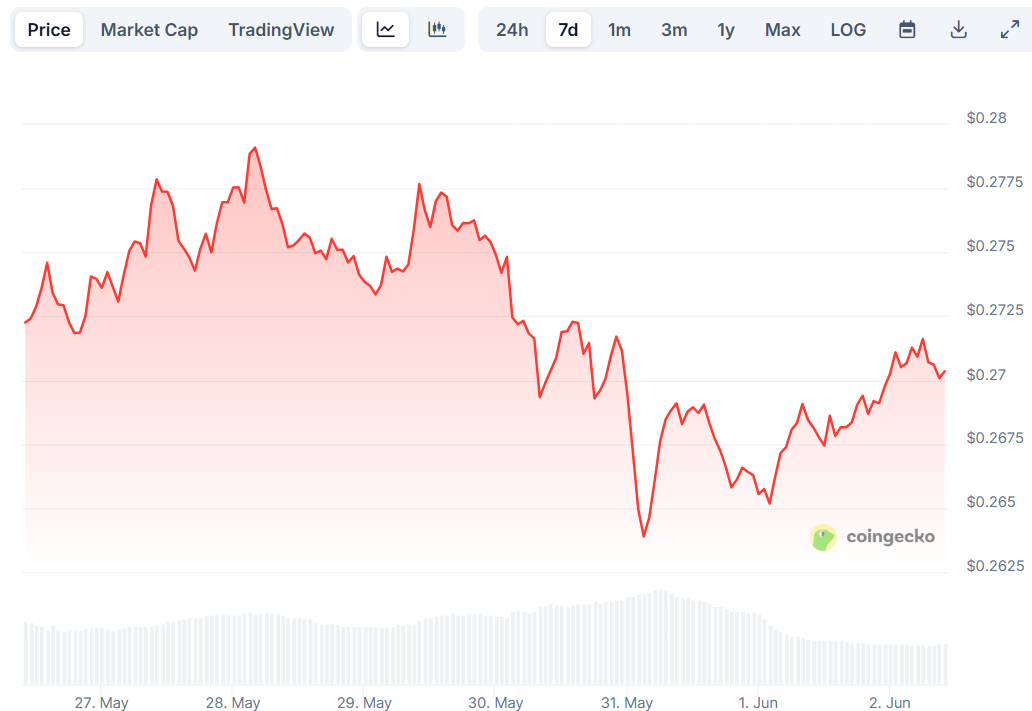
TRX managed to close above $0.274 twice in the past ten days. On both occasions, the price retreated to the $0.266 support level.
The current range has TRX oscillating between $0.22 at the low end and $0.274 at the high end. The mid-range level sits at $0.2475.
Bulls and bears continue to battle for control around the five-month range high at $0.274. Neither a clear breakout nor decisive rejection has occurred yet.
The On-Balance Volume has declined in recent weeks alongside the price consolidation. This metric lacks a clear trend direction currently.
Trading data shows the Spot Taker Trading Volume has flipped bearishly. This indicates a Taker Sell Dominant phase over the past 90 days.

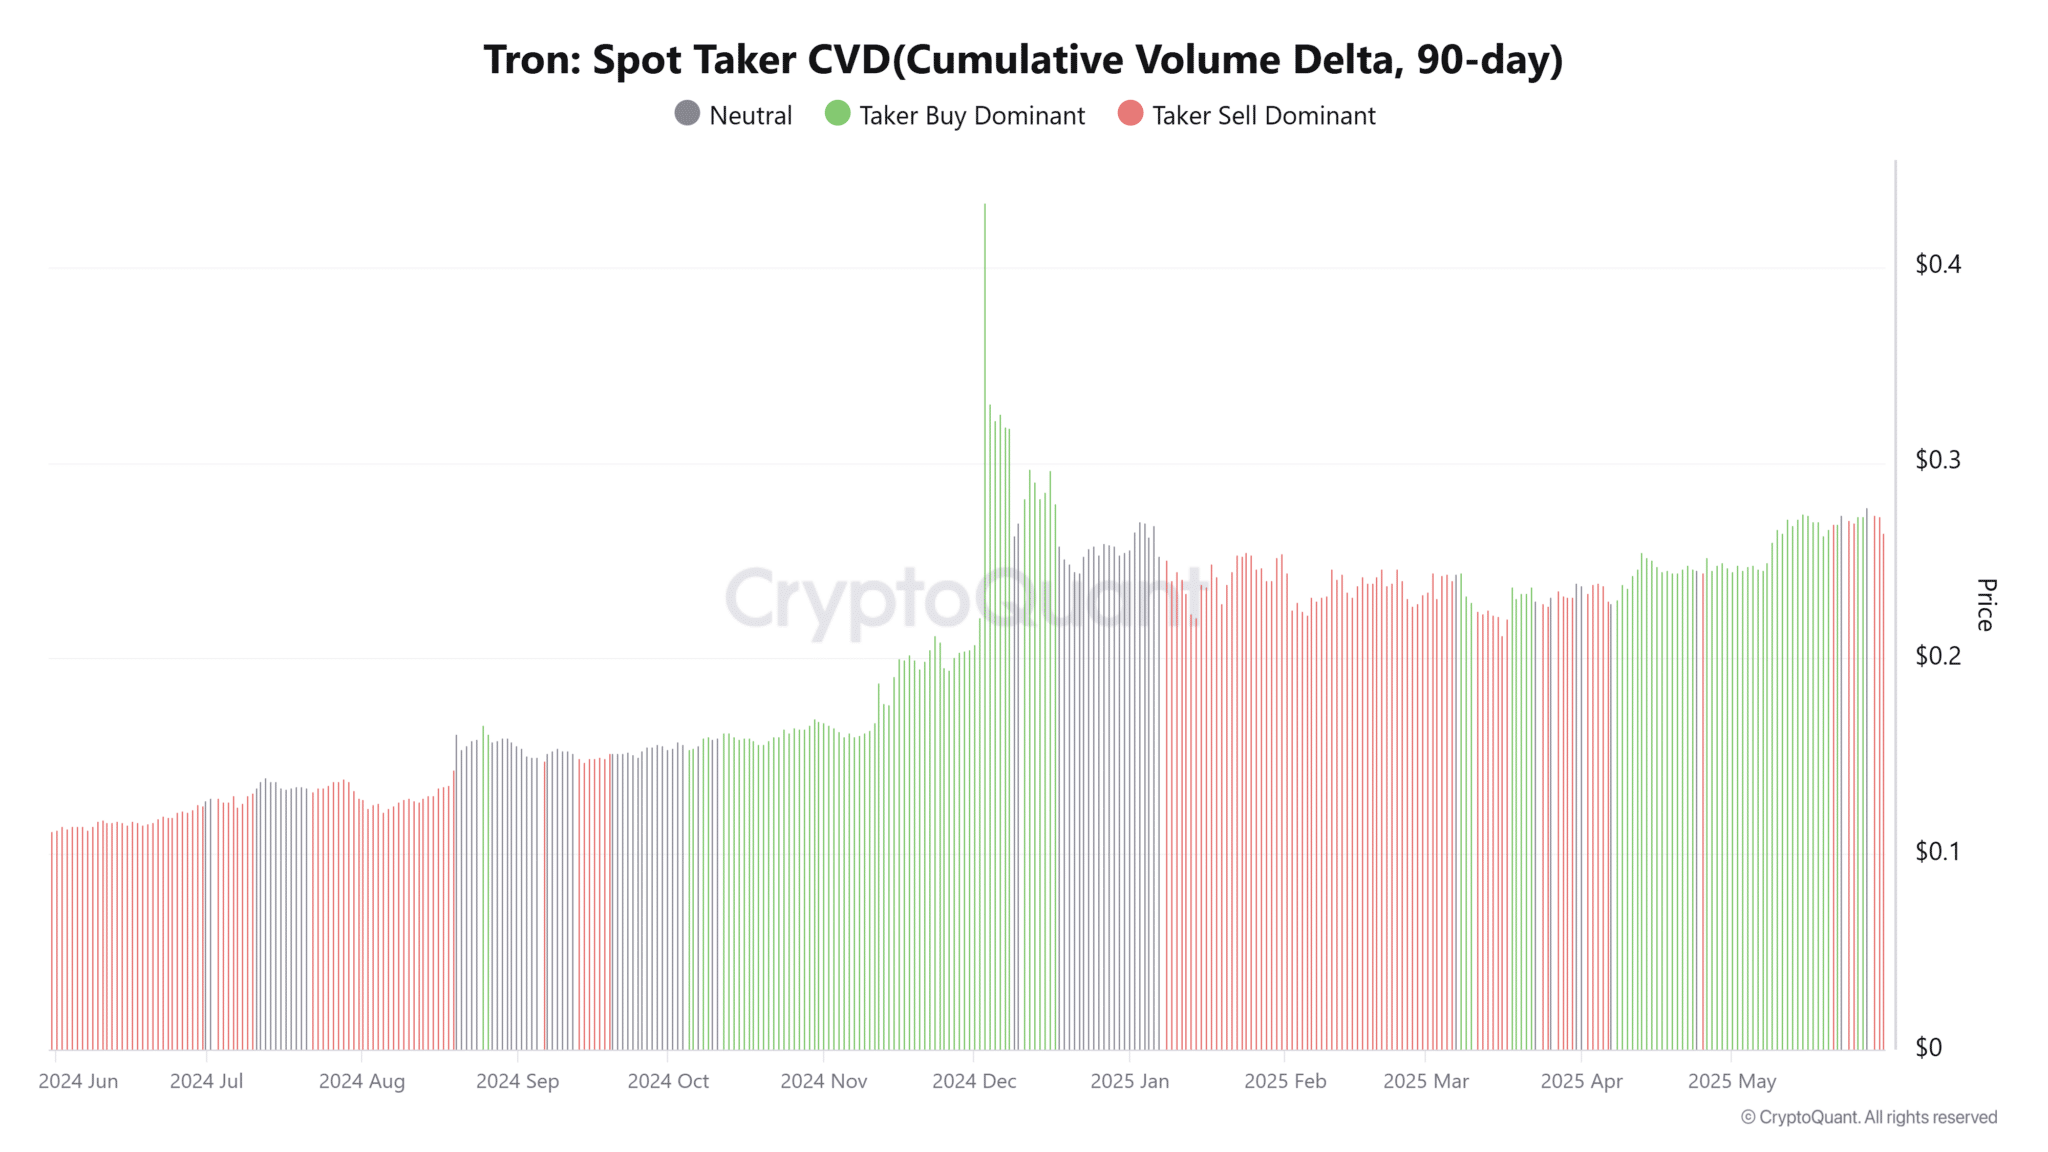
The metric was positive and growing in the first half of May. It began turning around over the past ten days.
Strong On-Chain Activity Supports Price Action
TRON’s ecosystem health shows encouraging signs with over 8 million transactions recorded recently. Transfer volume reached $25 million in the past 24 hours.
Total accounts climbed during the week despite broader market volatility. Staked TRX now sits at 43 billion tokens according to TronDAO’s latest statistics.
The token continues to respect its ascending channel structure. Price has bounced cleanly from the lower boundary of this long-standing channel.
Each time TRX has visited this ascending trendline, meaningful rallies have followed. The pattern suggests a slow grind higher rather than explosive moves.
Technical Levels Point to Key Breakout Zones
The broader chart reveals a cup-like formation with the neckline near $0.285 to $0.288. A breakout above this level could target the $0.320 to $0.340 region.
Liquidation heatmap data shows TRX could fall toward $0.255 or lower to $0.24. There is a cluster of liquidity around local lows made in May.
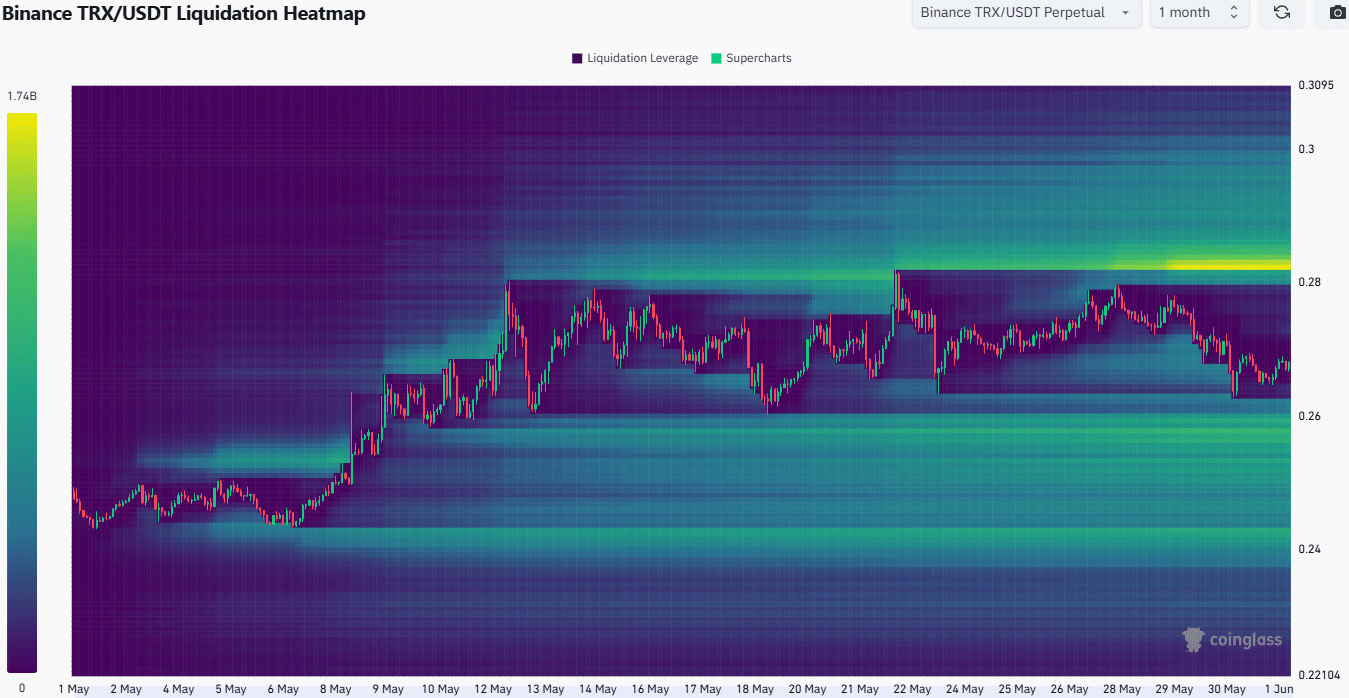
The $0.282 level has a high concentration of short liquidations. This area could be targeted in coming days.
Traders should watch the $0.28 level for potential long entries. Short positions around $0.255 may face challenges.
The current consolidation around $0.27-$0.275 continues without clear directional bias. A surge in buying pressure alongside a move beyond $0.274 would signal a strong breakout.
TRX holds above the $0.262 to $0.266 support zone while forming higher lows. The structure remains intact for potential upside moves.
Get 3 Free Stock Ebooks
Discover top-performing stocks in AI, Crypto, and Technology with expert analysis.
- Top 10 AI Stocks - Leading AI companies
- Top 10 Crypto Stocks - Blockchain leaders
- Top 10 Tech Stocks - Tech giants


