

TLDR
- 21Shares launched its Spot SUI ETF (TSUI) on Nasdaq February 24, marking the third SUI spot ETF available to U.S. investors.
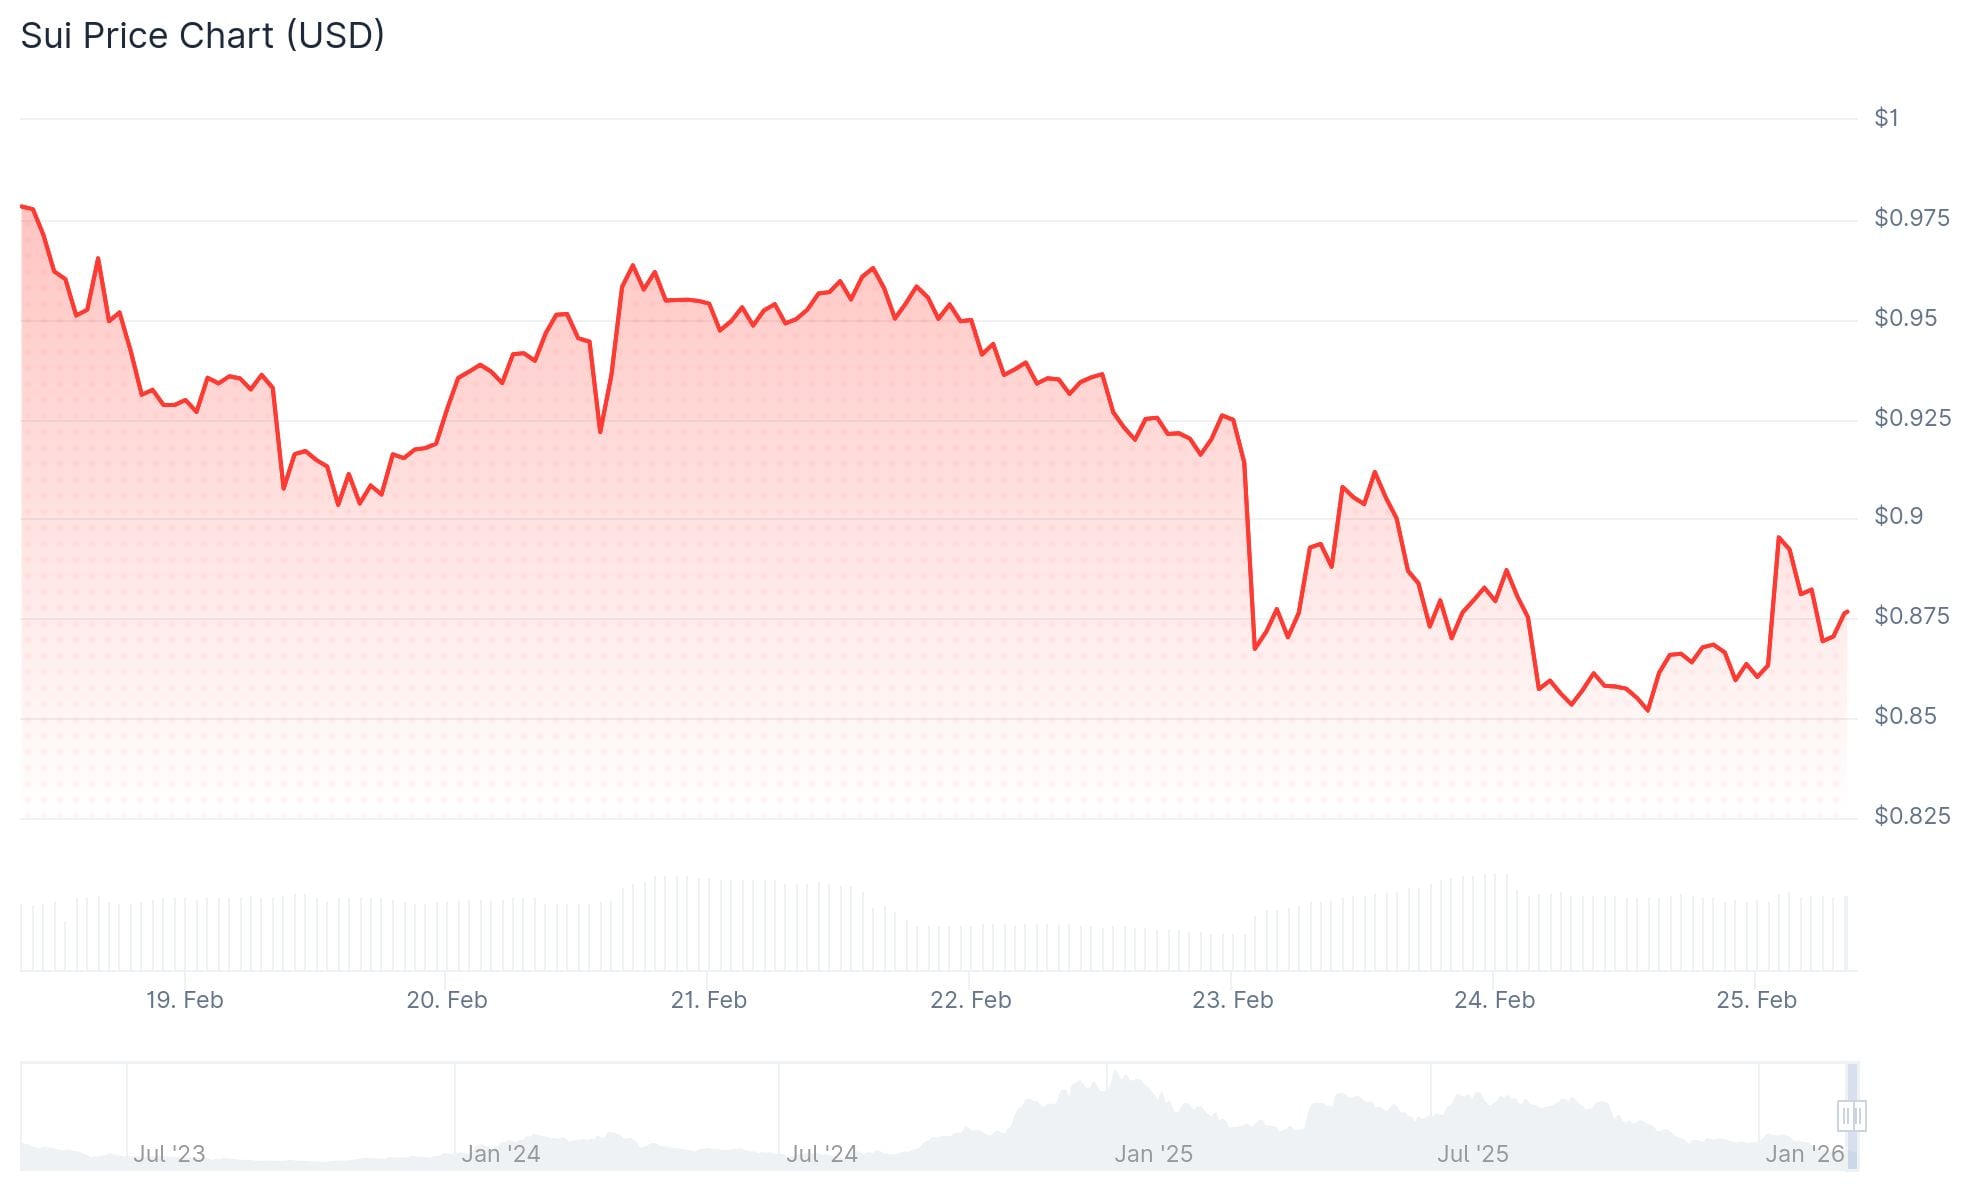
- The token currently trades around $0.87, reflecting a 40% decline over the last 30 days.
- Chart patterns indicate oversold territory with RSI hovering around 34, suggesting potential for a near-term rebound.
- March 1 brings a scheduled unlock of 48.87 million SUI tokens, representing 0.54% of circulating supply.
- Critical support established at $0.85–$0.87 range; reclaiming $1.00 would indicate bullish momentum returning.
The Sui token is defending a crucial support level as institutional investors gain another avenue for exposure through a newly listed exchange-traded fund.
On February 24, 2026, the 21Shares Spot SUI ETF commenced trading on Nasdaq under the symbol TSUI. The fund debuted with roughly $9.2 million in assets under management and features a 0.30% annual management fee, which the issuer has waived until October 2026.
This marks the third spot-based SUI ETF to reach the U.S. marketplace. Both Grayscale and Canary Capital previously rolled out their respective SUI investment products. Additionally, 21Shares introduced a staked version of their SUI ETF on Nasdaq earlier this month.
The latest offering provides American investors with regulated access to SUI price exposure via traditional brokerage platforms, eliminating the requirement for self-custody through cryptocurrency wallets.
At press time, SUI was changing hands near $0.87, reflecting a 3.4% increase over the preceding 24-hour period. However, this modest uptick comes against a backdrop of approximately 40% losses across the past month, with the token unable to sustain levels above the $1.00 threshold.

Spot market volume reached $474 million, representing a 12% decline from the previous session. Futures and derivatives volume contracted 14% to $685 million, while open interest decreased 2.8% to $447 million, indicating traders are reducing leveraged positions.
Technical Picture
SUI remains positioned beneath both its 20-day and 50-day simple moving averages, which currently function as resistance barriers. The 50-day moving average is located around $0.94.
The Relative Strength Index recently entered the low-30 territory, indicating oversold momentum conditions, and has started trending higher. The price action has been hugging the lower Bollinger Band, while band width is beginning to narrow — a technical configuration that often precedes increased volatility.
The MACD indicator continues trading beneath its signal line with negative histogram readings, confirming ongoing bearish momentum in the short term.
Immediate support rests at the $0.85–$0.87 zone. A decisive break below $0.80 could expose the $0.70 or even $0.65 levels. Conversely, a sustained breakout above $1.00 would likely target the $1.03–$1.20 resistance band.
Token Unlock Ahead
SUI tops the list of major cryptocurrency projects facing significant token unlocks this week. Data from CryptoRank indicates that 48.87 million SUI tokens are scheduled for release on March 1, accounting for 0.54% of the total token supply.
Market observers are evaluating whether capital flows into the new ETF products can counterbalance potential selling pressure generated by the unlock event.
The Sui blockchain has facilitated more than $100 billion in stablecoin transaction volume during the previous six months. Decentralized exchanges operating on the network recorded $6.5 billion in trading volume throughout the last 30-day period.
TSUI entered the market with $9.2 million in assets, and market participants are closely tracking fund flows to determine whether institutional appetite for SUI exposure is materializing.
Get 3 Free Stock Ebooks
Discover top-performing stocks in AI, Crypto, and Technology with expert analysis.
- Top 10 AI Stocks - Leading AI companies
- Top 10 Crypto Stocks - Blockchain leaders
- Top 10 Tech Stocks - Tech giants


