

- Solana remains in an ascending channel with strong demand near $170–$180.
- RSI holds above 50, signalling momentum remains positive on weekly charts.
- Analysts forecast Solana could reach $800–$1,000 before a retracement.
- Long-term demand zones are seen between $55 and $95 for the next accumulation phase.
Solana continues to maintain a strong technical posture as price action holds above the critical $170–$180 range. The digital asset trades near $190, reinforcing an ongoing medium-term uptrend supported by a rising channel structure. Recent trading behaviour suggests that bullish momentum remains healthy, with technical indicators confirming the potential for continuation if key support levels hold.
The broader picture shows that Solana is not only defending its recent gains but also forming a base for further expansion. Market structure, volume profiles, and relative strength all point to sustained investor confidence, even as short-term corrections emerge.
Ascending Channel Structure and Key Price Zones
The weekly chart of Solana (SOL/USD) on OKEX reveals a clear ascending channel, defining its medium-term trajectory. The lower trendline, which has acted as support since mid-2024, continues to attract strong buying activity whenever retested. Price remains anchored above the channel midpoint near $190, a zone that often dictates whether momentum shifts toward continuation or consolidation.
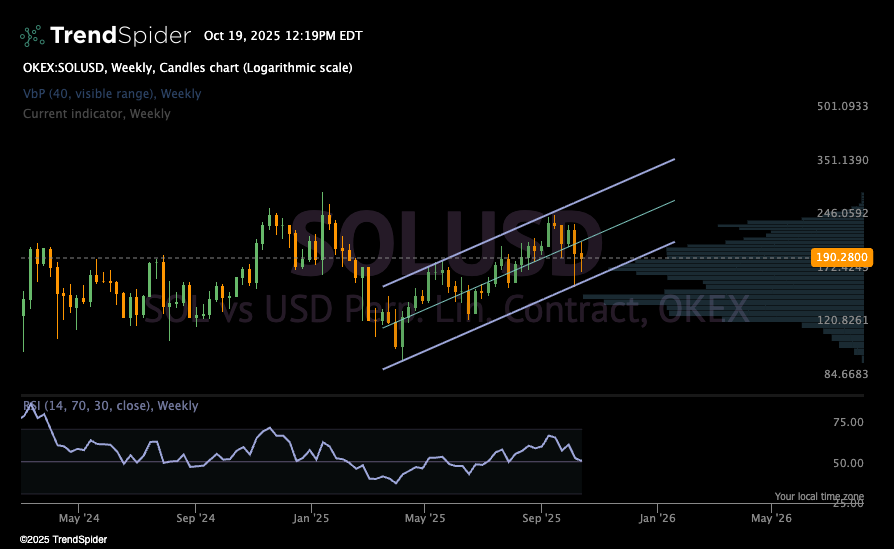
SOL/USD 1W Chart | Source: X
Weekly closes above $170–$180 have been crucial in maintaining market confidence. This zone coincides with a visible range high-volume node, suggesting that liquidity accumulation remains strong at these levels. A decisive break below this range would open a potential retest toward $126, where historical demand re-emerged earlier in 2025.

Momentum and Resistance Levels Shape Near-Term Outlook
Moreover, momentum indicators suggest that Solana’s trend remains intact, even with minor cooling. The weekly Relative Strength Index (RSI) continues to trend above 50, a sign that buyers still dominate the structure. Past movements show that when RSI approaches this midline, it often precedes a new impulse rally.
SOL/USD 1W Chart | Source: X
Immediate resistance now stands near $246, aligning with the upper boundary of the ascending channel. This level has served as a rejection point in previous months. Should the price manage to close above it on the weekly chart, the path toward $351 and potentially $500 becomes clearer. Traders may view a confirmed breakout above this threshold as the next signal for momentum acceleration.
Long-Term Patterns Indicate Multi-Year Cycle Expansion
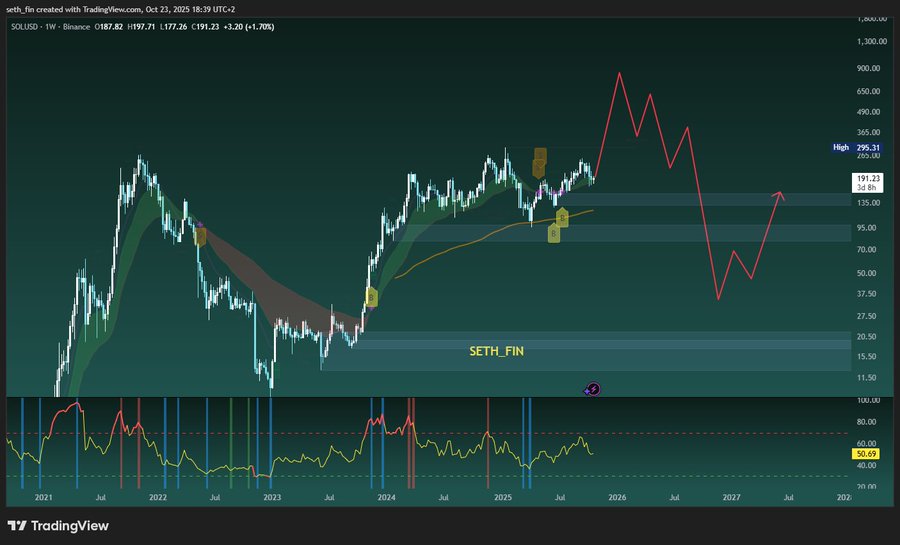
Consequently, the long-term chart, analyzed by market observer @SETH_FIN, projects Solana’s movement within broader market cycles. After recovering from its 2022 lows, Solana sustained a strong uptrend through 2024 and 2025, supported by the 200-week moving average. Historically, this line has acted as a launchpad for major expansions, validating Solana’s structural strength in each bullish phase.
The analysis outlines a possible rally extending toward the $800–$1,000 range by late 2026. Such an expansion would mirror prior cyclical extensions observed in Solana’s history. However, this projection also anticipates a retracement toward the $55–$85 range afterward, reflecting a typical post-cycle correction before the next accumulation phase begins.
Broader Perspective Suggests Patience Amid Expected Volatility
In essence, the shaded regions between $55 and $95 on historical volume profiles mark strong institutional demand. Liquidity in these zones has repeatedly absorbed sell pressure during corrections, reinforcing them as high-probability re-entry regions for long-term participants.
For investors, this phase of Solana’s development presents a two-step cycle an extended bullish run followed by a re-accumulation period. While the next two years could deliver substantial gains, patience may be essential once momentum peaks. The consistent growth of Solana’s ecosystem and on-chain participation continues to lend confidence that, despite temporary volatility, the long-term trend remains constructive.
Get 3 Free Stock Ebooks
Discover top-performing stocks in AI, Crypto, and Technology with expert analysis.
- Top 10 AI Stocks - Leading AI companies
- Top 10 Crypto Stocks - Blockchain leaders
- Top 10 Tech Stocks - Tech giants


