
 Tumbles Below $80 as Historic Eight-Month Decline Continues")
Key Takeaways
- SOL has experienced an unprecedented eight consecutive months of declining prices, marking a historic first for the network.
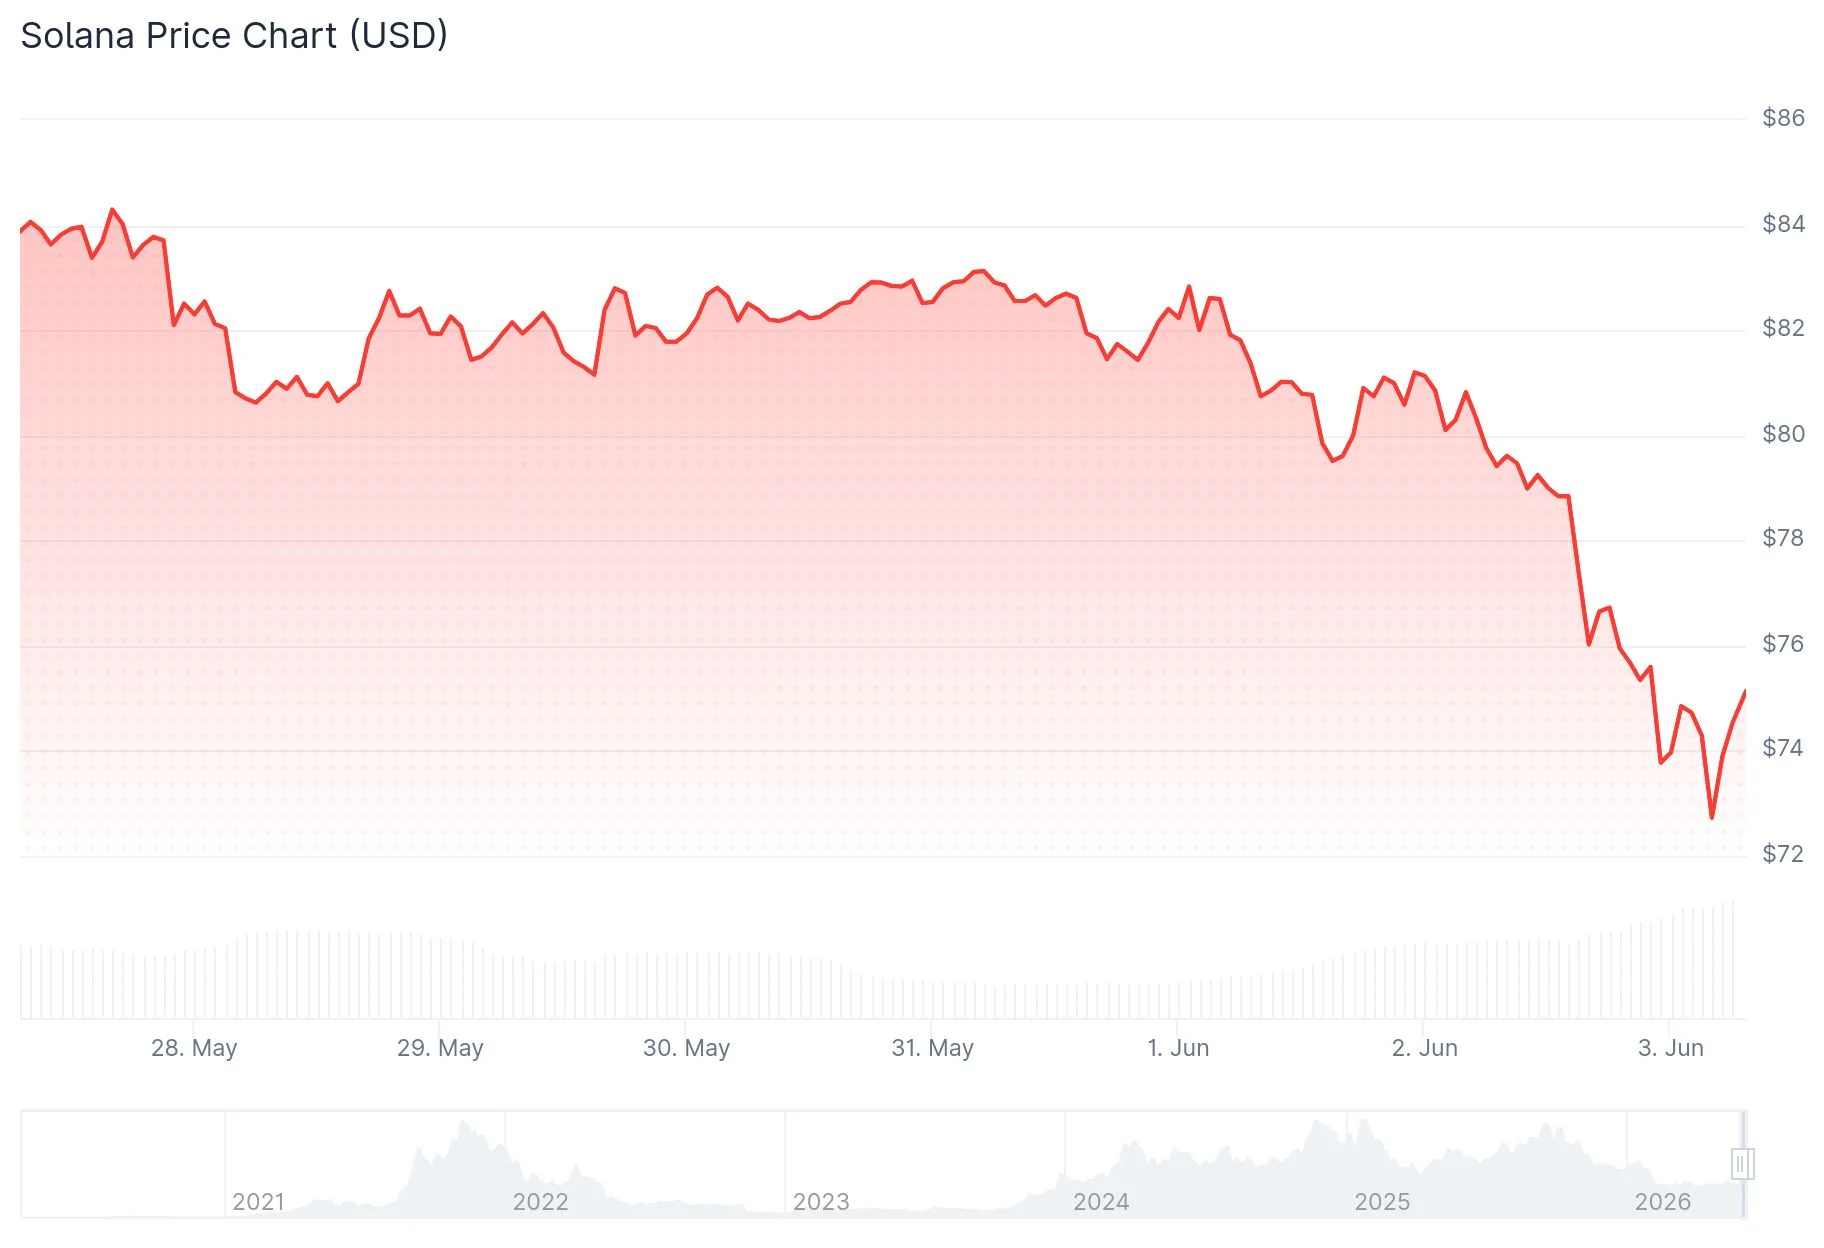
- The digital asset pierced crucial $80 support and descended to $75.58, with technical analysts monitoring $70 as the next significant level.
- Decentralized exchange activity on Solana plummeted 82% during late May, dropping from $104.3B to $18.8B.
- Institutional Bitcoin ETF products experienced $1.42 billion in withdrawals during the week through May 29, continuing an eleven-day outflow trend.
- Technical analyst CryptoBullet forecasts potential decline toward $50 territory by July should bearish momentum persist.
Solana (SOL) experienced approximately 5% depreciation on Tuesday amid widespread cryptocurrency market weakness. The aggregate digital asset market capitalization contracted 3.44% within a 24-hour window. Exhibiting heightened volatility characteristic of high-beta cryptocurrencies, SOL initially declined to approximately $77 before extending losses to an intraday floor of $75.58.
This downturn extends Solana’s unprecedented eighth consecutive month of negative performance, representing the lengthiest bearish sequence throughout the network’s entire operational history. Year-to-date 2026 losses now stand at 36.4%. Comparatively, Ethereum has declined 33.5% during the identical timeframe, a parallel that has attracted scrutiny considering Solana’s previous positioning as a superior growth alternative to ETH.
U.S.-listed Bitcoin spot exchange-traded funds recorded $1.42 billion in aggregate net withdrawals throughout the week concluding May 29, extending redemption activity to eleven consecutive trading sessions. Market strategists interpret this pattern as institutional investors retreating from risk-oriented holdings. Historical correlation suggests that weakening Bitcoin ETF demand typically exerts amplified downward pressure on alternative cryptocurrencies such as SOL.
Blockchain Metrics Signal Deteriorating Momentum
Blockchain analytics reinforce the pessimistic outlook. Solana’s weekly decentralized exchange transaction volume contracted 82% during the latter portion of May, collapsing from $104.3 billion to $18.8 billion as speculative meme token enthusiasm evaporated. Daily active wallet addresses persist around 2.1 million, maintaining SOL’s third-place ranking among Layer 1 blockchain platforms for this engagement metric. However, revenue performance presents a contrasting narrative: throughout the trailing twelve months, Solana accumulated $317.6 million in total fees while capturing merely $39.1 million in protocol revenue, a margin that underperforms Tron’s $3.1 billion substantially.
SOL maintains its position as the seventh-largest cryptocurrency by market valuation at $44.58 billion.

Technical Analysis Suggests Further Downside
The critical $80 price floor, which had provided stability through multiple retests over recent months, has now been definitively violated. Technical theory suggests that breached support zones frequently convert into resistance barriers during subsequent rallies. All moving average indicators monitored through TradingView, spanning from the 10-period through the 200-period configurations, currently display Sell recommendations. The Relative Strength Index registers 29.38, entering technically oversold territory, though within established downtrends such readings frequently precede continued selling rather than bullish reversals.
Derivatives open interest has contracted to $5.48 billion while funding rates hover near neutral at -0.0025%, indicating absence of substantial short positioning that might catalyze a short squeeze rally.
Technical analyst CryptoBullet, who characterized the formation as a “big breakdown,” projects Solana potentially descending toward the $50 zone by July. In the immediate term, $70 represents the subsequent probable target should the $75–$78 consolidation range fail to provide support. Achieving a legitimate trend reversal would necessitate SOL recapturing $80 followed by clearing $85 resistance.
SOL has depreciated 9.23% across the current week, 46.63% throughout the past six months, and 38.05% year-to-date. Despite recent weakness, the five-year return remains positive at 149.62%.
Get 3 Free Stock Ebooks
Discover top-performing stocks in AI, Crypto, and Technology with expert analysis.
- Top 10 AI Stocks - Leading AI companies
- Top 10 Crypto Stocks - Blockchain leaders
- Top 10 Tech Stocks - Tech giants


