
 Shows Recovery Signs as Technical Indicators Point to Possible Upside")
Quick Overview
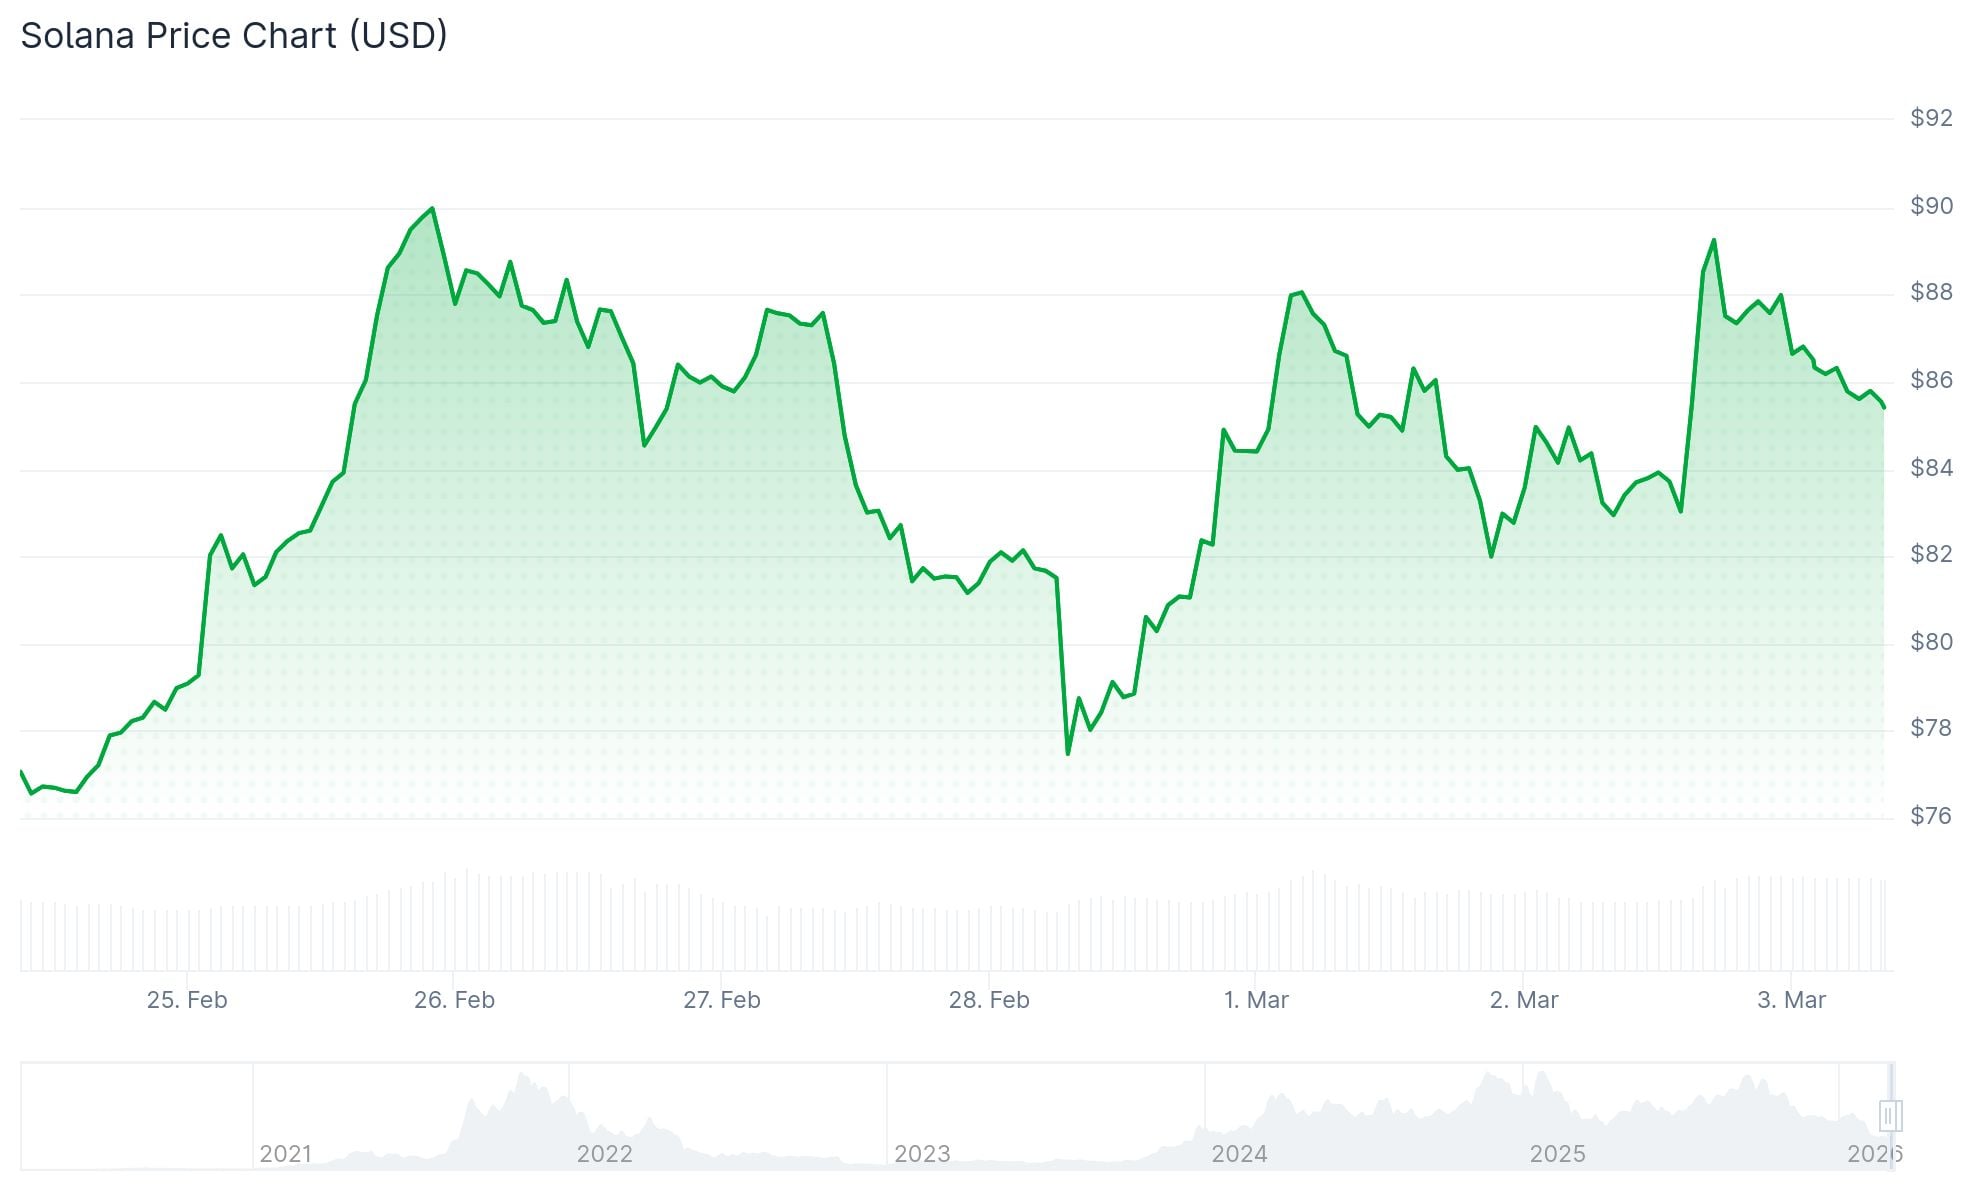
- SOL retreated beneath $88 following a rejection at $90 but discovered solid footing near $85
- The RSI reading of 47.68 indicates neutral conditions without clear directional bias
- For the first time since January, SOL has moved above the Ichimoku cloud on 4-hour timeframes
- Market observers identify $88.60 as the critical threshold; clearing this level may trigger a climb to $95–$100
- A bullish crossover occurred as the 50MA moved above the 100MA, suggesting near-term momentum improvement
Solana (SOL) is currently changing hands in the $87–$88 range following a retreat from its recent peak at $90.29. The digital asset slipped beneath both the $88 and $87 marks before stabilizing above the $85 price floor.
SOL maintains its position above the 100-hour simple moving average at present. Daily trading volume registers at $9.99 billion, while the network’s market capitalization stands at $49.91 billion. The token has gained 4.70% in the last 24-hour period.
The recent downward move pushed price beneath the 50% Fibonacci retracement level calculated from the $81.71 to $90.29 swing. An ascending trend line has emerged on hourly charts, providing support around $85—a zone that coincides with the 61.8% Fibonacci retracement.
On March 2, technical analyst BitGuru observed that SOL appears to have completed its correction phase and transitioned into accumulation. He highlighted the formation of successive higher lows around a well-defined support area as indication that selling momentum is diminishing.
Traders are closely monitoring $88.60 as the initial critical threshold to overcome. According to market observer More Crypto Online, reclaiming Sunday’s high at $88.60 would demonstrate that buyers are reasserting dominance.

Critical Overhead Barriers
Immediate resistance appears at $88, followed by $90 and $92. Breaking decisively above $92 would likely clear the pathway toward $96, with $100 as the next major target.
Should SOL struggle to surpass $90, attention shifts to downside targets at $84 and subsequently $82. A sustained close beneath $82 could trigger a decline toward $76.50.
The Relative Strength Index reads 47.68—firmly in neutral territory. The MACD indicator shows 1.80, marginally positive but remaining beneath the signal line at -4.29. Selling pressure has diminished, though buyers haven’t established definitive control.
Solana remains positioned significantly below its major moving averages. The 50-day simple moving average sits at $103.66, the 100-day at $117.73, and the 200-day at $156.34.
Ichimoku Cloud Reclaim Suggests Momentum Change
Examining the 4-hour timeframe, SOL has pushed above the Ichimoku cloud barrier for the first occasion since January concluded. During February’s trading sessions, every upward attempt met resistance at this cloud formation.
The 50-period moving average has also completed a bullish crossover above the 100-period moving average on 4-hour charts. Technical analyst CryptoCurb characterized this development as representing a fundamental shift in underlying trend dynamics.
Both moving averages have begun sloping upward. Chart projections published by CryptoCurb suggest potential advancement toward $100 and higher levels, provided price action maintains position above recently recaptured support zones.
Currently, SOL trades at $87.64 with preliminary recovery indicators visible, though a confirmed trend reversal remains unestablished.
Get 3 Free Stock Ebooks
Discover top-performing stocks in AI, Crypto, and Technology with expert analysis.
- Top 10 AI Stocks - Leading AI companies
- Top 10 Crypto Stocks - Blockchain leaders
- Top 10 Tech Stocks - Tech giants


