
 Records Unprecedented 8-Month Losing Streak as Analysts Monitor Critical Support Levels")
TLDR
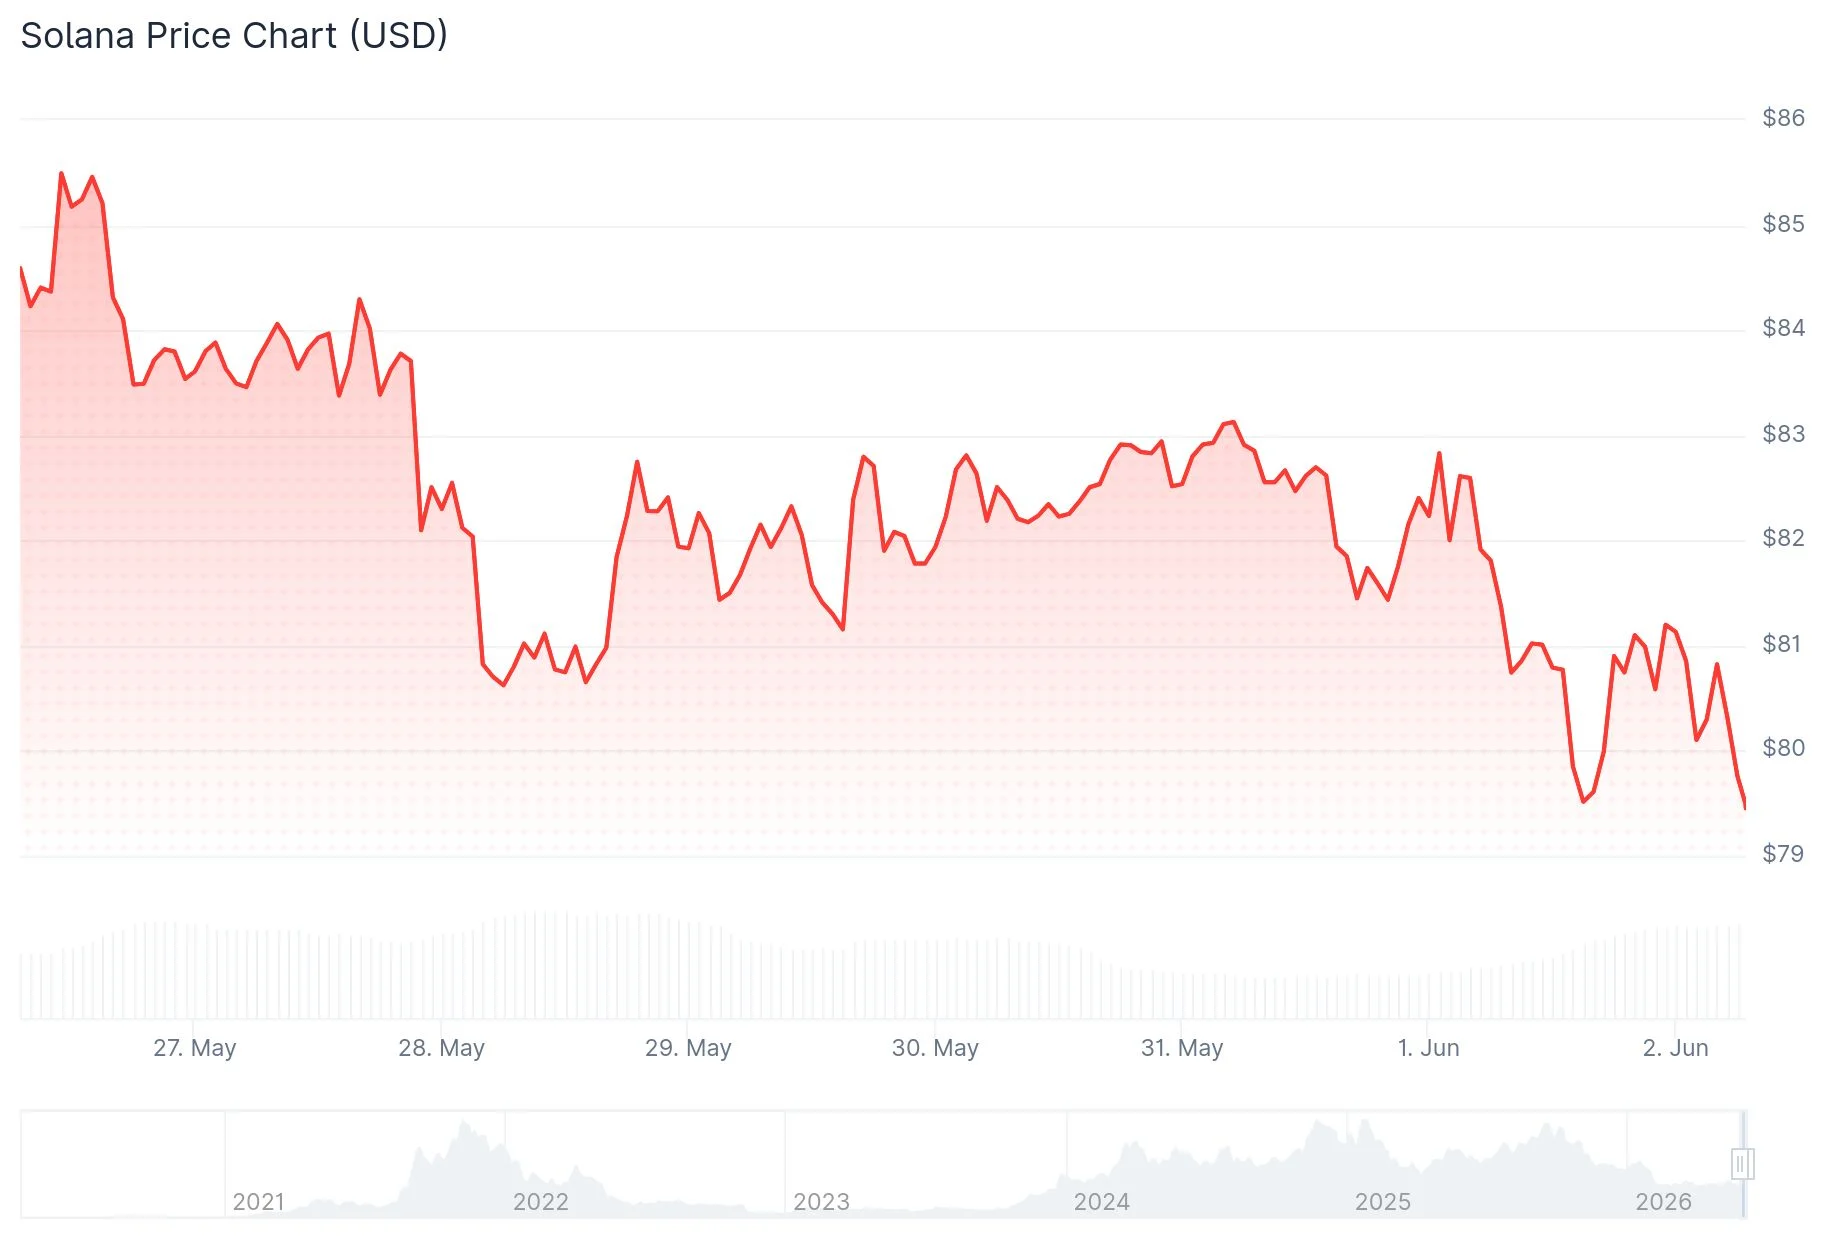
- SOL maintains position near $79.50, confined within a $76–$90 trading corridor lasting multiple months
- Network participants have decreased from 3 million to under 2 million; both DEX trading volume and Open Interest show downward trends
- Short liquidation concentration exists in the $83–$87 range, potentially catalyzing an upward move if activated
- Market analyst Crypto Patel highlights that SOL’s current 8 consecutive red monthly candles represent an unprecedented occurrence — echoing dynamics from the 2021 bear market
- Critical support level established at $68.02; breaching this threshold would negate the prevailing bullish technical formation
Solana has experienced a prolonged downtrend spanning several months, with on-chain metrics increasingly validating this weakness. The digital asset currently hovers near $79.50, confined within a trading range that has persisted since the beginning of this year.
The Solana network’s active user base has experienced a consistent decline from approximately 3 million participants in early 2025 to roughly 1.9 million currently. This represents a substantial decrease in genuine platform engagement.
Decentralized exchange activity has similarly contracted significantly from earlier 2025 peaks. Multi-billion dollar daily trading volumes have evaporated, with no indication of trend reversal.
Derivatives and Network Metrics Show Parallel Weakness
Solana derivatives Open Interest has contracted from approximately $3 billion at its peak to around $2.1 billion presently. Market participants are reducing exposure and decreasing leveraged positions.
The peculiar aspect is that funding rates maintain positive territory. This indicates traders continue holding bullish bias despite weakening fundamental data supporting such positioning.

From a technical analysis perspective, analyst Man of Bitcoin is monitoring a compression pattern developing on the four-hour timeframe. SOL is being compressed between descending resistance and rising support trendlines, with a breakout appearing imminent. His identified critical level: $68.02. A decline beneath this threshold would invalidate the constructive chart formation.
Should SOL break upward, initial resistance appears near $98, followed by additional targets at $110.54, $120.47, and $126.95.
Analyst CryptoCurb presented a long-term weekly timeframe chart illustrating Solana constructing an extended consolidation pattern spanning 2024 through 2026. His anticipated price objective reaches $1,000, though this scenario requires confirmation above the current range’s upper boundary.
Crypto Patel Identifies Unprecedented Historical Pattern
Market analyst Crypto Patel published comprehensive analysis on X, identifying an occurrence never before witnessed in Solana’s trading history: 8 consecutive monthly red candles.
He referenced the 2021 bear market, during which Solana plummeted from $260 down to $8. That decline generated 9 red monthly candles — though not in consecutive sequence. The 9th candle established the cycle bottom, with SOL subsequently achieving a new all-time high around $295 during the subsequent two-year period.
Patel notes the 9th monthly candle is currently developing, and he’s monitoring the $80–$50 zone as a probable accumulation area. Should the previous cycle’s pattern replicate, he anticipates SOL could target a new all-time high within the $500–$1,000 range over the coming one to two years.
On shorter timeframes, liquidation information from Coinglass reveals concentrated short positions between $83 and $87. If SOL advances into this zone, cascading liquidations could generate rapid upward price momentum.
Primary downside support remains at $76. Primary upside catalyst positioned at the $83–$87 short liquidation concentration zone.
Get 3 Free Stock Ebooks
Discover top-performing stocks in AI, Crypto, and Technology with expert analysis.
- Top 10 AI Stocks - Leading AI companies
- Top 10 Crypto Stocks - Blockchain leaders
- Top 10 Tech Stocks - Tech giants


