
 Price Eyes Critical $88 Resistance After 6% Surge — Key Levels Ahead")
Key Takeaways
- SOL pushed through the $82 and $85 price levels after completing a bullish flag pattern breakout on shorter timeframes.
- The token touched $87.04 before experiencing a mild pullback, stabilizing around mid-$80s territory.
- Bulls are now facing a critical resistance zone between $87.20 and $88.
- Downside protection exists at $83.75, followed by $82.70, with $80 serving as major support if selling pressure increases.
- Technical indicators present a mixed picture, showing near-term bullish momentum while longer timeframe signals remain subdued.
Solana (SOL) experienced notable upward movement on April 8 as a renewed buying wave carried the cryptocurrency beyond both $82 and $85 price points. This advance restored a constructive short-term technical formation for SOL.
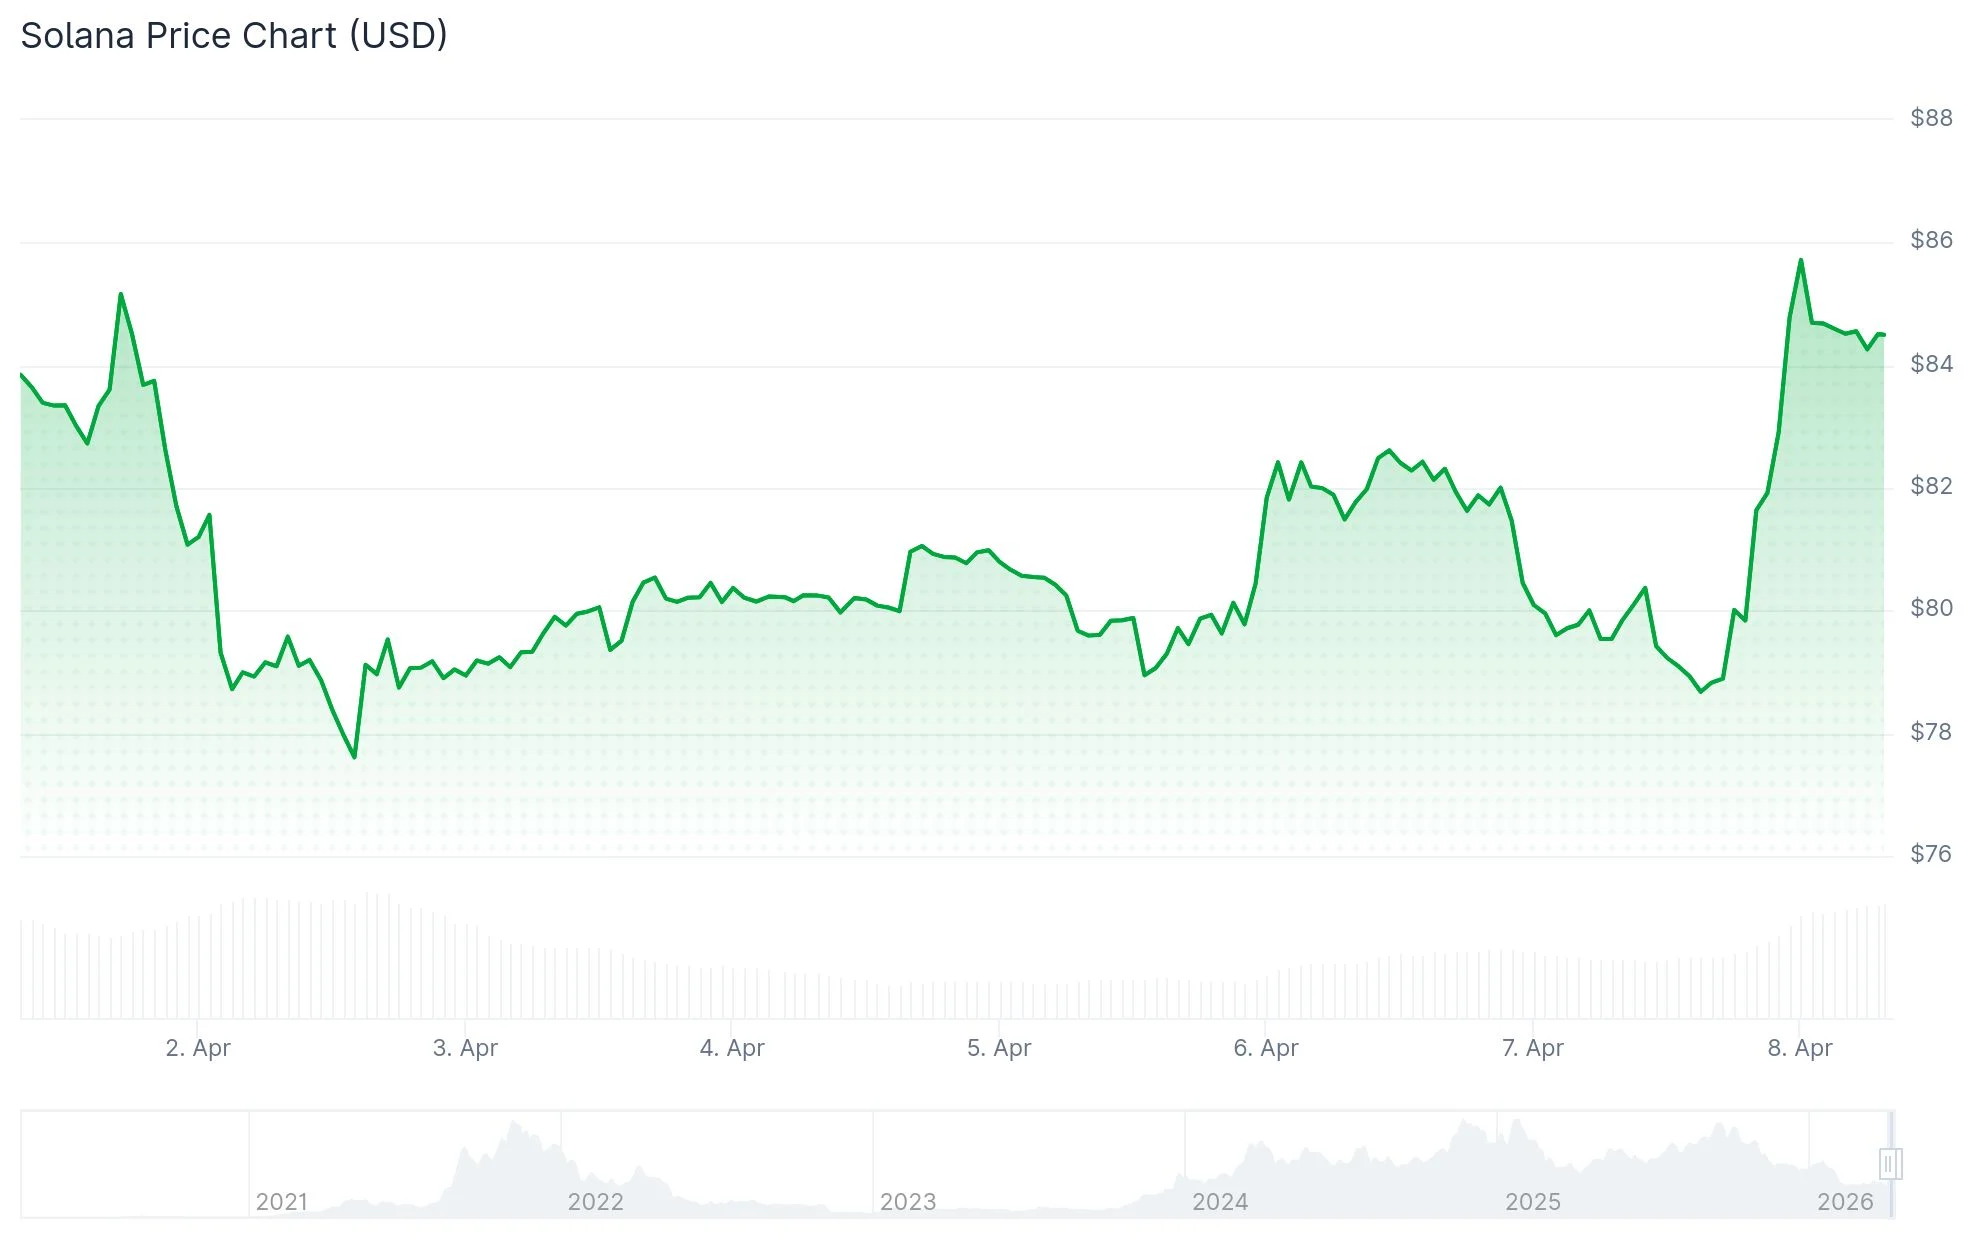
The cryptocurrency peaked at $87.04 during the session before encountering some profit-taking. Trading activity subsequently settled in the $84-$85 range, preserving the majority of intraday gains.
Technical analysis of the hourly chart reveals SOL successfully breached a bullish flag formation that had capped price action at $80. This technical breakout catalyzed the current upward trajectory.
The token is currently positioned above its 100-hour simple moving average, which maintains bullish focus on upcoming resistance thresholds.
Immediate overhead resistance emerges around $85, while the primary upside target zone clusters near $88.

Should bulls successfully breach $88, subsequent resistance levels materialize at $95 and $102. Extended strength could potentially unlock a path toward $112.
Recent advance encounters technical headwinds
Market data indicated SOL recorded a 5.85% daily gain, bringing prices to approximately $84.18. This positioning places the asset marginally beneath both its 20-day and 50-day moving averages.
The 200-day moving average remains significantly elevated at $134.10. Meanwhile, the Ichimoku Kijun indicator near $87.19 represents the most immediate overhead obstacle.
This technical configuration maintains trader attention on the $87.20-$88 zone. Currently, SOL continues navigating this critical price band.
Momentum indicators presented divergent readings. While RSI exhibited modest bullish tendencies, both Stoch RSI and BBP suggested overbought territory following the sharp rally.
Analysis suggests a probable near-term trading range spanning $83.50 to $86.50, barring a definitive breakout. This projection aligns with current consolidation patterns following the upward move.
Downside protection levels under observation
Should Solana prove unable to clear $88, bearish pressure may resurface. The first line of defense appears near $83.75.
A more substantial support floor exists near $82.70, corresponding to the 50% Fibonacci retracement level calculated from the $78.38 to $87.04 advance. Further below, the $80 threshold commands significant attention.
A confirmed close beneath $80 could trigger selling toward $75, effectively negating the recent short-term recovery effort.
Technical analyst Ali Charts noted Solana remains confined within a broader consolidation pattern, bounded by resistance at $96.04 and support at $76.66. According to his assessment, the upcoming 48-hour period could prove decisive for April’s trajectory, with sustained support potentially triggering a rebound toward $81 and $85, while failure below $76.66 might expose $68.54.
Additional context includes recent security initiatives launched by the Solana Foundation alongside evolving regulatory developments in the United States. However, current market attention remains firmly anchored on price action: SOL rallied to $87.04 and now faces a critical test of whether buyers possess sufficient strength to penetrate the $87.20-$88 resistance band.
Get 3 Free Stock Ebooks
Discover top-performing stocks in AI, Crypto, and Technology with expert analysis.
- Top 10 AI Stocks - Leading AI companies
- Top 10 Crypto Stocks - Blockchain leaders
- Top 10 Tech Stocks - Tech giants


