
 Price Eyes $100 Breakout as Network Metrics Surge to Record Levels")
Key Highlights
- Solana (SOL) hovers around its 50-day EMA at approximately $75, a critical technical threshold for bullish continuation.
- Growing retail optimism reflected in elevated funding rates alongside Open Interest maintaining levels above $5 billion.
- ETF flows remain inconsistent, with SOL funds recording $2.50 million in outflows Wednesday following prior day’s $5.52 million inflows.
- Network metrics from Grayscale reveal approximately 100 million daily transactions with 4.3 million active users.
- Crypto analyst Michaël van de Poppe identifies $77 breakthrough as potential catalyst for rally toward $125-$130 range.
Solana maintains its position around $75 during Wednesday’s trading session. The cryptocurrency is currently challenging its 50-day Exponential Moving Average, a technical indicator that market participants monitor for momentum signals.
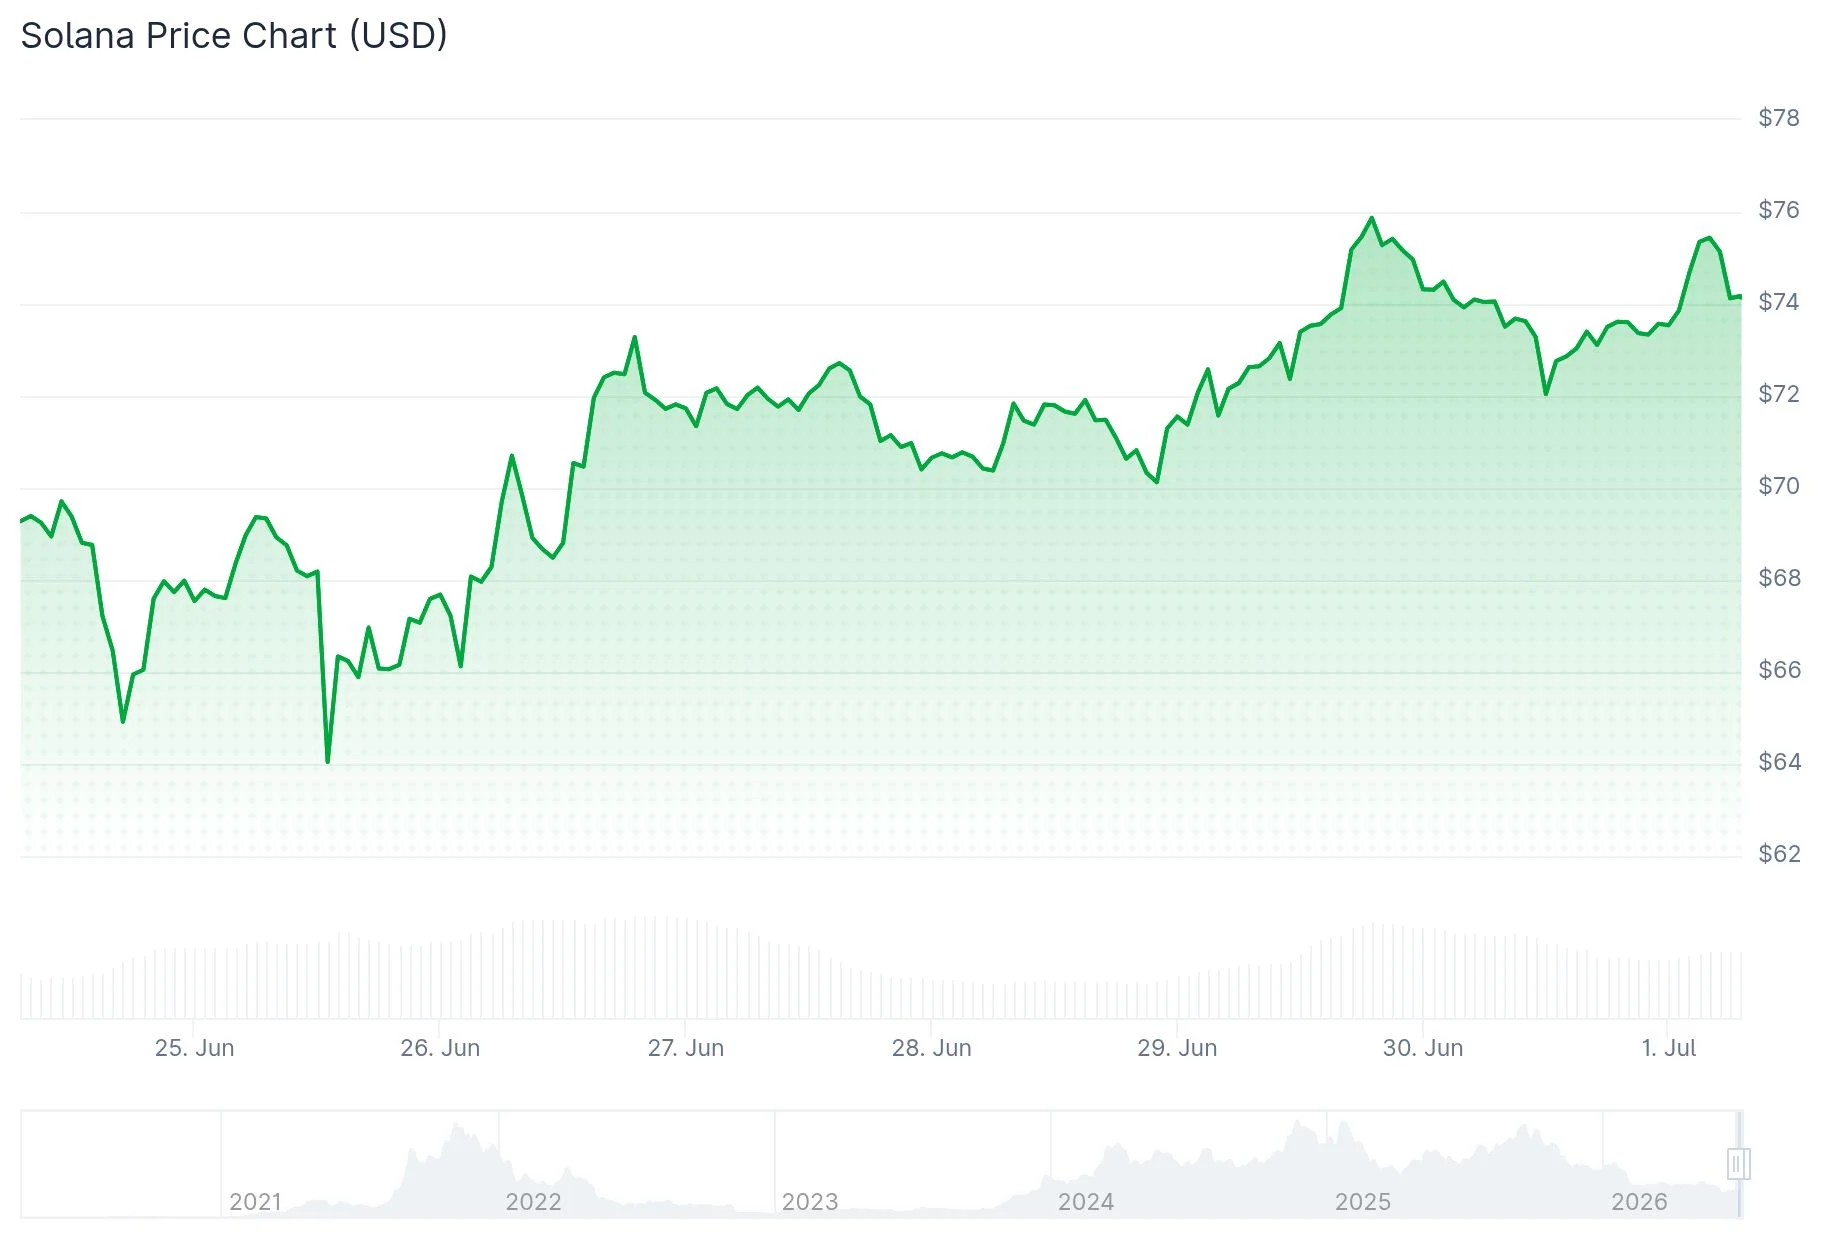
Successfully closing above this moving average would establish a pathway toward the 200-day EMA, currently positioned near $98.79. Such movement would position SOL in striking distance of the psychologically significant $100 threshold—a level unseen in recent weeks.
Retail participation shows signs of strengthening. According to CoinGlass metrics, Open Interest stands at $5.33 billion, maintaining stability above the $5 billion benchmark following last month’s decline.
Funding rates, which indicate demand for leveraged long positions in futures markets, climbed to 0.0073% Wednesday. This elevation indicates traders are accepting higher costs to maintain bullish exposure on SOL.
Mixed Signals from Institutional Capital
Spot ETF movements present a more ambiguous picture. Solana-focused exchange-traded funds experienced $2.50 million in net outflows Wednesday, reversing the previous day’s $5.52 million inflow.

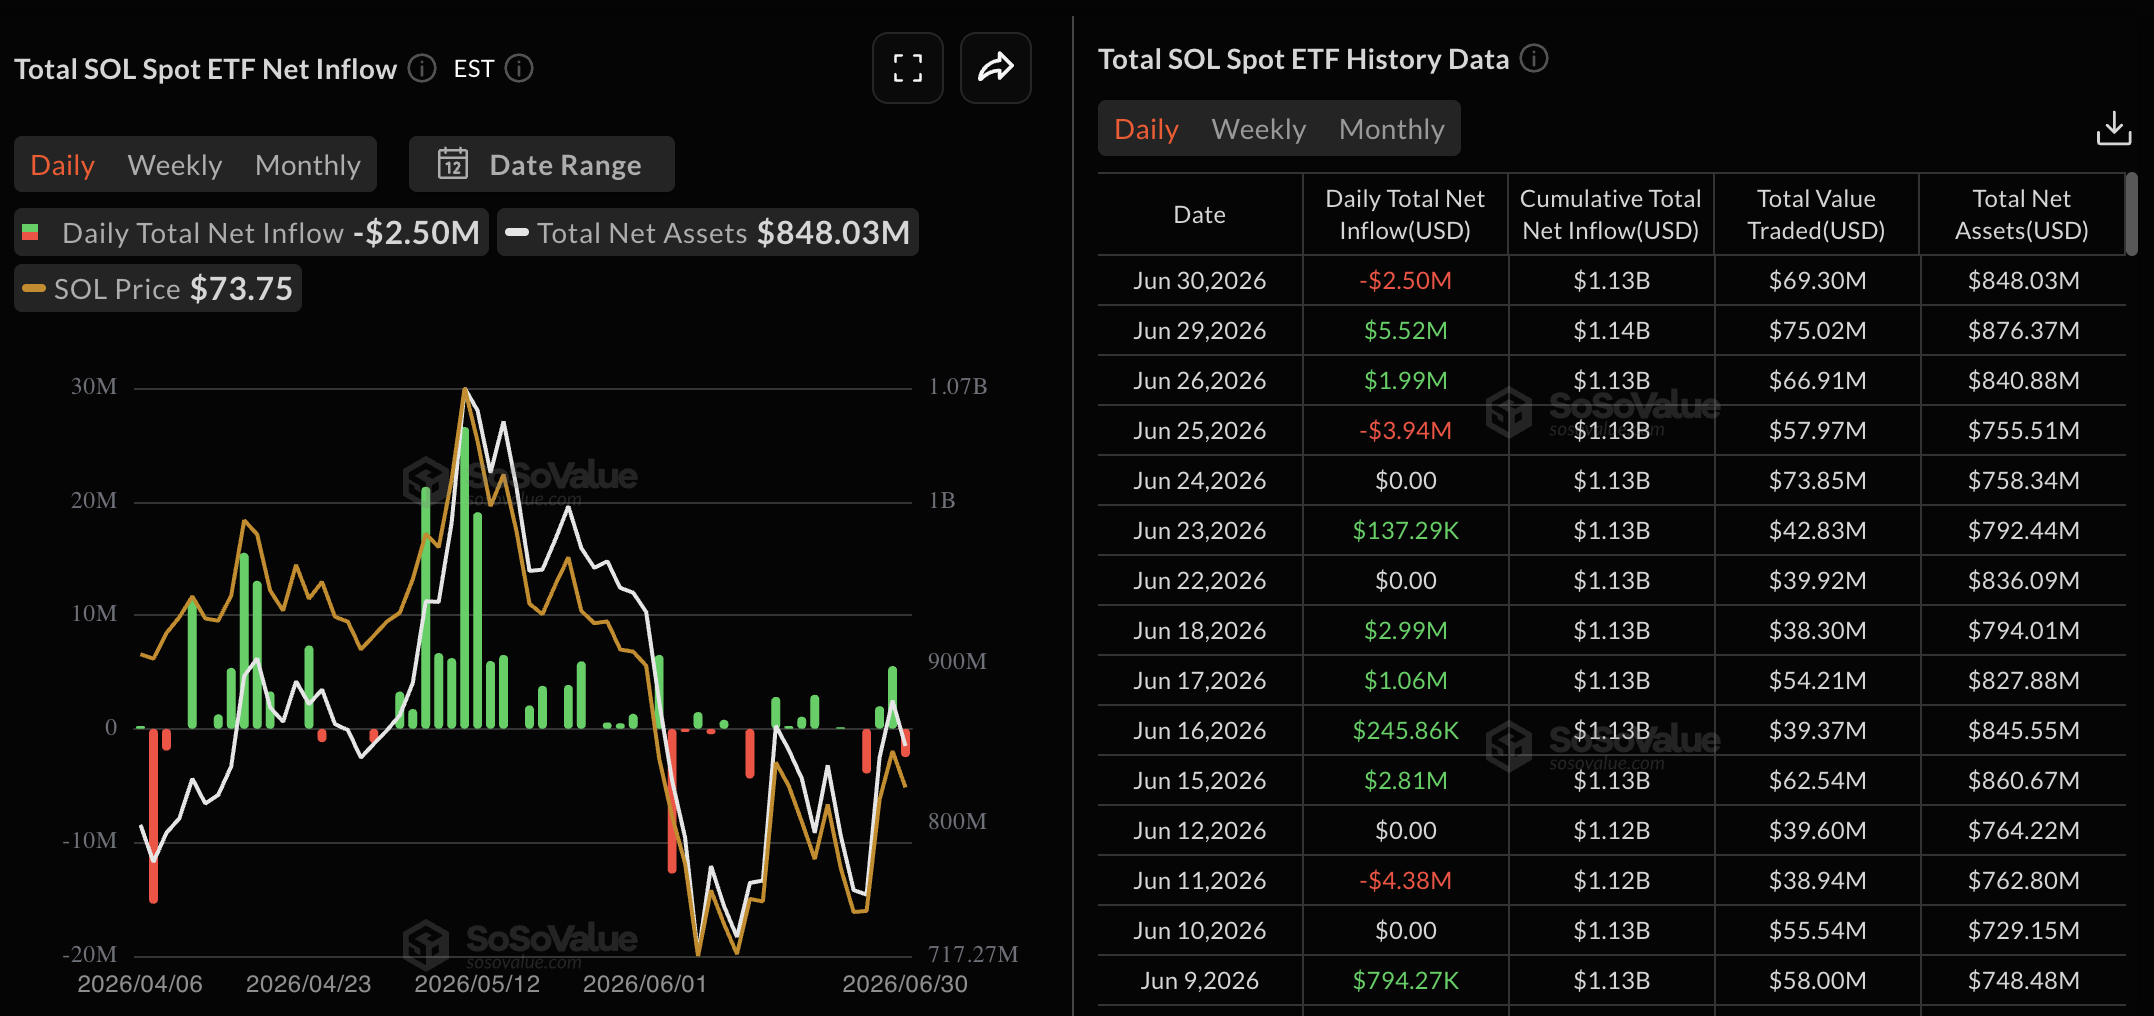
This oscillating behavior suggests institutional players are adopting a cautious posture rather than establishing firm directional conviction.
Technical indicators display constructive readings. The Relative Strength Index registers at 55, positioned slightly above neutral territory, while the MACD line trends upward toward positive ground.
Should SOL lose its grip on the 50-day EMA, market watchers may shift focus to the February 6 bottom at $67.50. A sustained breakdown beneath the $60 threshold would compromise the broader bullish framework.
Trader and analyst Michaël van de Poppe commented on X that Solana’s shorter timeframe charts “actually do look good.” He identified a potential range breakout scenario with $77 serving as the critical activation point, potentially triggering upside movement toward the $125-$130 region.
His perspective provides additional context for traders evaluating whether retail momentum possesses sufficient strength to overcome resistance barriers.
Blockchain Utilization Reaches New Peaks
Independent of price movements, Grayscale emphasized sustained engagement on the Solana network platform. The investment manager documented approximately 1,200 transactions per second with roughly 100 million daily transaction volume.
Grayscale additionally noted 4.3 million distinct daily active users alongside over $100 million in transaction fees accumulated year-to-date.
The asset manager highlighted Raydium, Pump.fun, and GEODNET as representative applications driving user adoption on the blockchain.
Current price action near $72.76 positions SOL directly above a demand zone that historically attracted purchasing interest during previous market cycles, based on onchain intelligence. This support area has maintained integrity throughout the current week.
Market participants now monitor whether SOL can sustain momentum from present levels or whether a retreat toward earlier support structures materializes in coming sessions.
Get 3 Free Stock Ebooks
Discover top-performing stocks in AI, Crypto, and Technology with expert analysis.
- Top 10 AI Stocks - Leading AI companies
- Top 10 Crypto Stocks - Blockchain leaders
- Top 10 Tech Stocks - Tech giants


