
 Price: Critical $78 Level Must Hold or Face Drop to $60 and Below")
Key Takeaways
- Solana is currently hovering around $68–$69 following a 5–7% decline over the past day, testing crucial support zones
- Bulls face a decisive battle at the $75–$78 resistance level to prevent additional downside momentum
- A major whale initiated a 20x leveraged short position on 554,680 SOL (approximately $38 million) around $69, intensifying bearish sentiment
- Breaking below the $60 support could trigger a significant correction toward the $40–$30 territory
- Technical indicators suggest weakening bearish momentum, though confirmation requires a sustained move above key levels
Solana has experienced a notable decline in recent trading sessions, shedding over 5% to settle in the $68–$69 range. The cryptocurrency is hovering near its daily floor, with bears maintaining control of short-term price action.
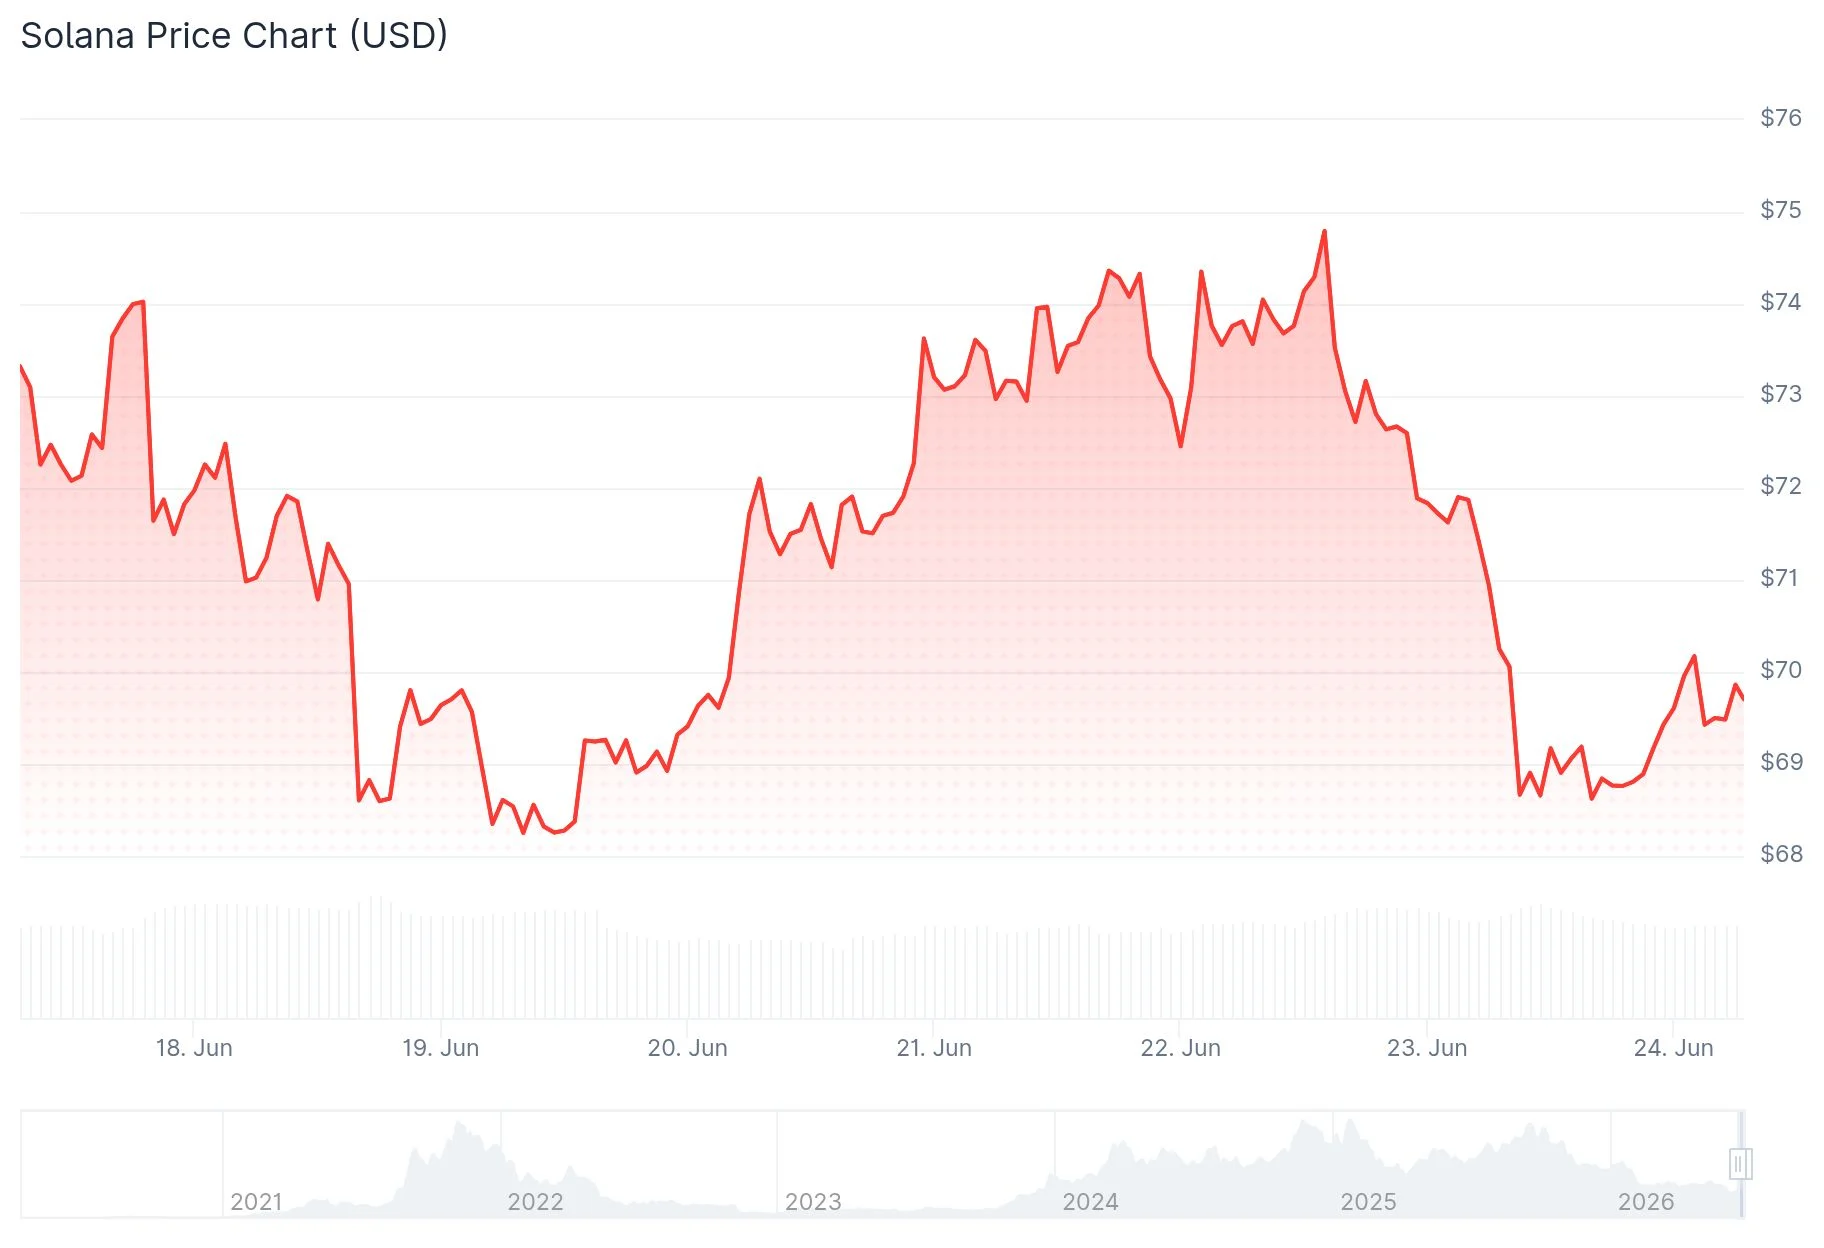
Current market data shows SOL recording a 24-hour trading volume of approximately $5.07 billion alongside a market capitalization of roughly $39.92 billion. Today’s trading has seen prices fluctuate between $68.41 at the bottom and $72.80 at the peak.
Despite an attempt to bounce back earlier in the trading session, SOL couldn’t maintain support above the $70 threshold, resulting in a retreat toward the lower boundary of today’s range.
Major Whale Initiates Substantial Short Position at $69
According to data from blockchain analytics service Lookonchain, a significant market player has established a 20x leveraged short position involving 554,680 SOL tokens, valued at roughly $38.15 million. This position was opened near the $69.23 price level, with a breakeven point around $69.19.
Given that SOL is trading at approximately the same price point, this substantial short position is hovering near profitability. The position continues to exert downward pressure on market psychology as long as prices remain beneath the $69–$70 threshold.

Cryptocurrency analyst Sjuul from AltCryptoGems highlighted on June 22 that selling pressure continues to dominate SOL’s price action, though buyers are attempting to establish local support. The analyst emphasized that successfully flipping the $78 level represents the critical objective for bullish traders, identifying it as the catalyst for a “power of 3” expansion pattern — while cautioning traders against aggressive long positions until that threshold is secured.
Recapturing $70 followed by $72 would begin to alleviate bearish momentum, but until that materializes, market attention remains focused on downside targets at $68, $64, and $60.
The $75–$78 Range Represents the Critical Battleground
Market analysts are concentrating their attention on the $75–$78 price corridor. This zone has been identified as the pivotal resistance area that will determine Solana’s near-term trajectory. Should SOL successfully break above and maintain support at $78, the subsequent price objectives would be $85 followed by the $90 zone.
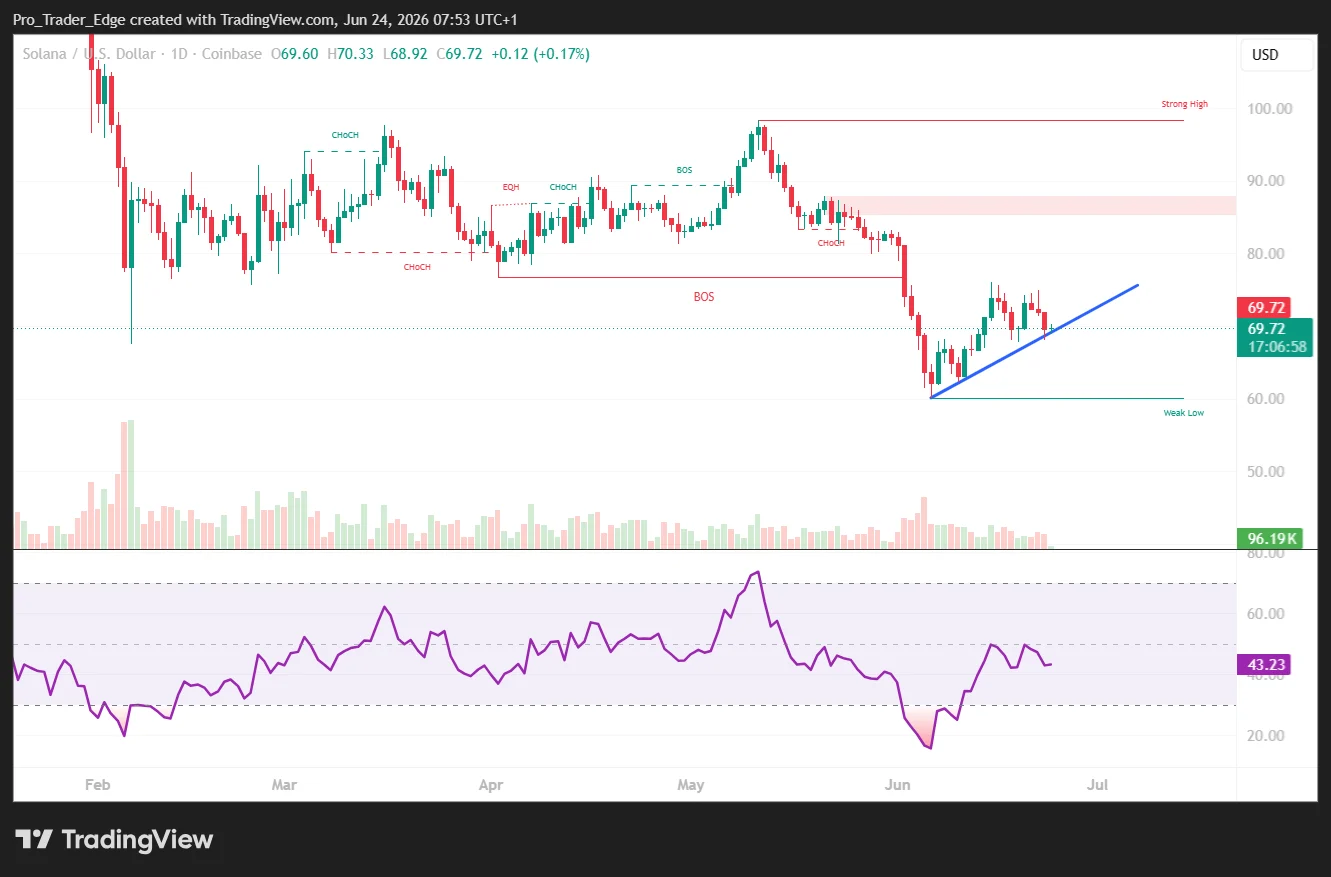
Conversely, a rejection from this critical zone would preserve the existing bearish framework. Failure to breach this resistance could drive prices back toward the $64–$60 range.
Should the $60 support level fail, extended cycle analysis indicates a potential support corridor between $55 and $40 where buyers may attempt to establish a foundation.
From a technical perspective, the MACD indicator shows a reading of -1.81 versus a signal line at -2.59, with the histogram registering +0.79. These metrics suggest that selling momentum may be decelerating, though a genuine reversal would require a breakthrough above the middle Bollinger Band positioned near $68.72.
The upper Bollinger Band is located at $75.69, corresponding with the resistance zone market watchers have identified as critical.
Solana has maintained a vulnerable trend pattern since October 2025, with current pricing remaining beneath the broader $80–$90 recovery zone that would need to be conquered for a more constructive trend to emerge. Latest market data places SOL near $69, positioned just under the $70 mark that represents the initial hurdle bulls must overcome.
Get 3 Free Stock Ebooks
Discover top-performing stocks in AI, Crypto, and Technology with expert analysis.
- Top 10 AI Stocks - Leading AI companies
- Top 10 Crypto Stocks - Blockchain leaders
- Top 10 Tech Stocks - Tech giants


