
 Price: Critical $70 Support Holds as Bulls Eye $80 Breakout")
TLDR
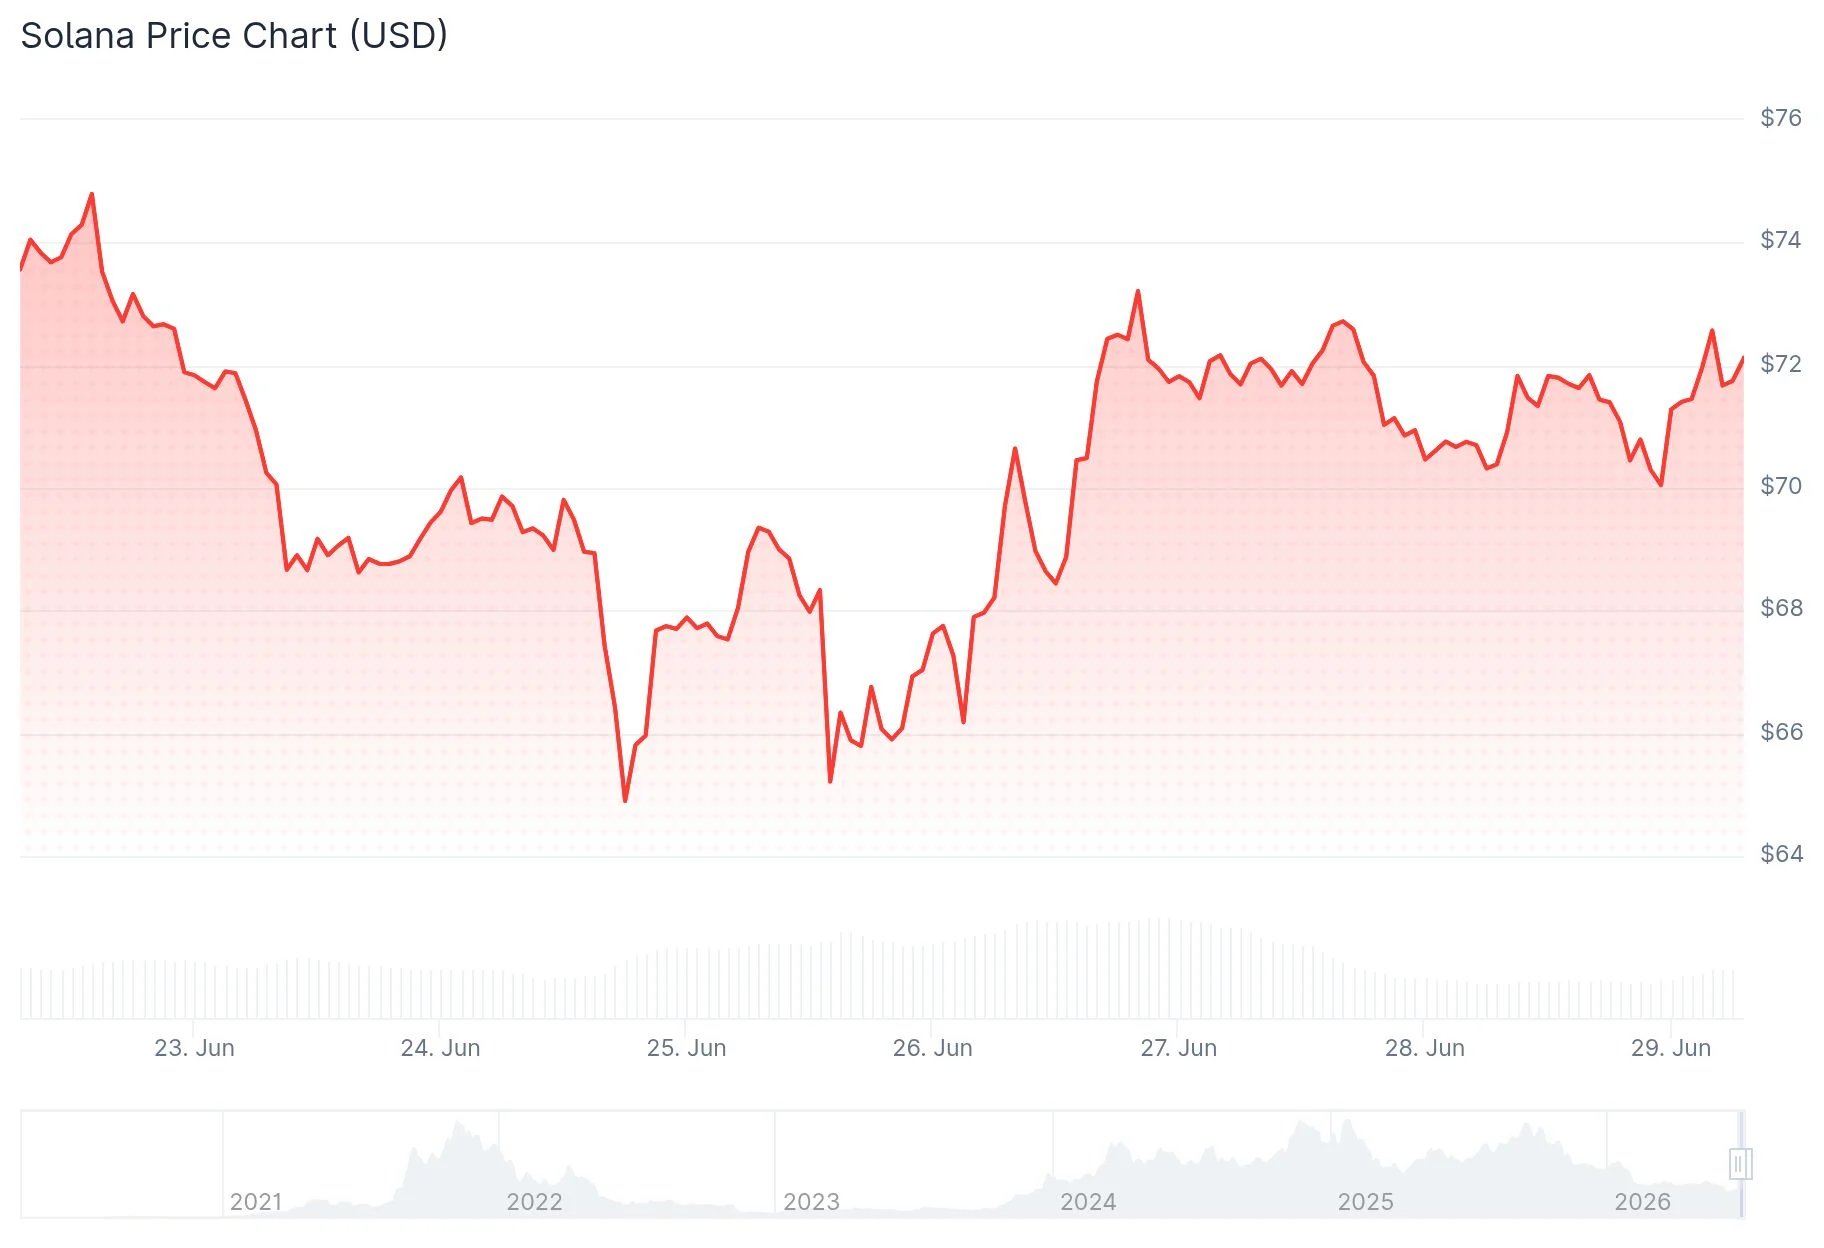
- Solana is currently hovering around $70.67, testing a critical descending resistance line
- Breaking above $80 resistance could trigger rallies toward $90 and $95 price levels
- Daily trading volume for tokenized equities on Solana reached a record $553 million
- Crypto analyst Michaël van de Poppe projects potential targets of $120–$130 during Q3/Q4 2026
- Technical chart formations indicate ambitious long-term targets approaching $500 upon resistance breakout
As of June 29, 2026, Solana is changing hands around $70.67, marking a 24-hour decline of approximately 1.82%. The cryptocurrency maintains its position above the crucial $70 support threshold, though market participants await confirmation of a bullish reversal.
Traders are closely monitoring the $72–$75 price range, which represents a critical juncture where a descending resistance trendline converges. Bulls must successfully reclaim this territory to initiate a more substantial upward movement.
Should SOL successfully pierce through the $75 threshold, attention shifts to the $80 mark. This level represents the primary confirmation signal that market participants are tracking closely.
A decisive daily close above the $80 resistance would tilt short-term momentum in favor of buyers, opening pathways toward $90 and $95. The $90 region aligns with notable upside liquidity clusters visible on technical charts.
Conversely, failure to maintain the $70 support could trigger a decline toward the $65–$60 range. A more severe correction would potentially revisit the $50 liquidity concentration area.

Trading expert Michaël van de Poppe shared his perspective on X, indicating that SOL appears positioned for a range breakout. He suggested that momentum is unlikely to stall once this occurs, characterizing a range flip as a straightforward buying signal. Van de Poppe outlined expectations for $120–$130 as feasible objectives during the third or fourth quarter of this year.
Network Activity Picks Up
Tokenized equity trading on Solana achieved an unprecedented daily volume milestone of $553 million. Market analyst Whale Factor emphasized that Solana’s blockchain utility is diversifying well beyond meme token speculation and conventional cryptocurrency exchanges.
The real-world asset (RWA) ecosystem on Solana now commands $3.18 billion in aggregate value across more than 291,000 holders, establishing it as the leading blockchain platform by RWA participant count.
Application revenue generated on Solana totaled $19 million over the previous week and $85 million throughout the past month. Decentralized exchange spot trading volume registered $12.3 billion weekly.
Long-Term Chart Patterns
Technical analyst JAVONMARKS identified a cup and handle formation on the 12-day timeframe. A confirmed breakout above the $260–$280 resistance band accompanied by robust volume would validate this pattern, projecting targets exceeding $500.
Analyst Crypto Patel has outlined a longer-horizon strategy involving Solana accumulation within the $40–$60 range, with ambitious targets set at $500 and $1,000. He drew parallels between the current retracement and the 2022–2023 consolidation phase that preceded the subsequent 2023–2024 rally.
An additional falling wedge formation remains in play across the broader timeframe, suggesting a long-term objective near $233 should SOL ultimately escape this technical structure.
The daily chart still requires a confirmed close above the descending trendline to substantiate the bullish thesis. The weekly MACD indicator has yet to signal a bullish crossover, according to analyst Dami-Defi.
SOL most recently traded at $71.44, representing a 0.43% decrease over the past 24 hours, based on Brave New Coin data.
Get 3 Free Stock Ebooks
Discover top-performing stocks in AI, Crypto, and Technology with expert analysis.
- Top 10 AI Stocks - Leading AI companies
- Top 10 Crypto Stocks - Blockchain leaders
- Top 10 Tech Stocks - Tech giants


