
 Price Analysis: Will SOL Surge to $90 or Face Further Decline?")
Key Takeaways
- SOL maintains support around $80 with key resistance established near $87
- Fibonacci analysis identifies $88-$90 as next technical targets
- Weekly timeframe analysis preserves bullish scenario toward $1,000
- Solana ETFs experienced more than $17 million in net outflows during the past week
- Derivatives open interest dropped to $4.72 billion, indicating diminished speculation
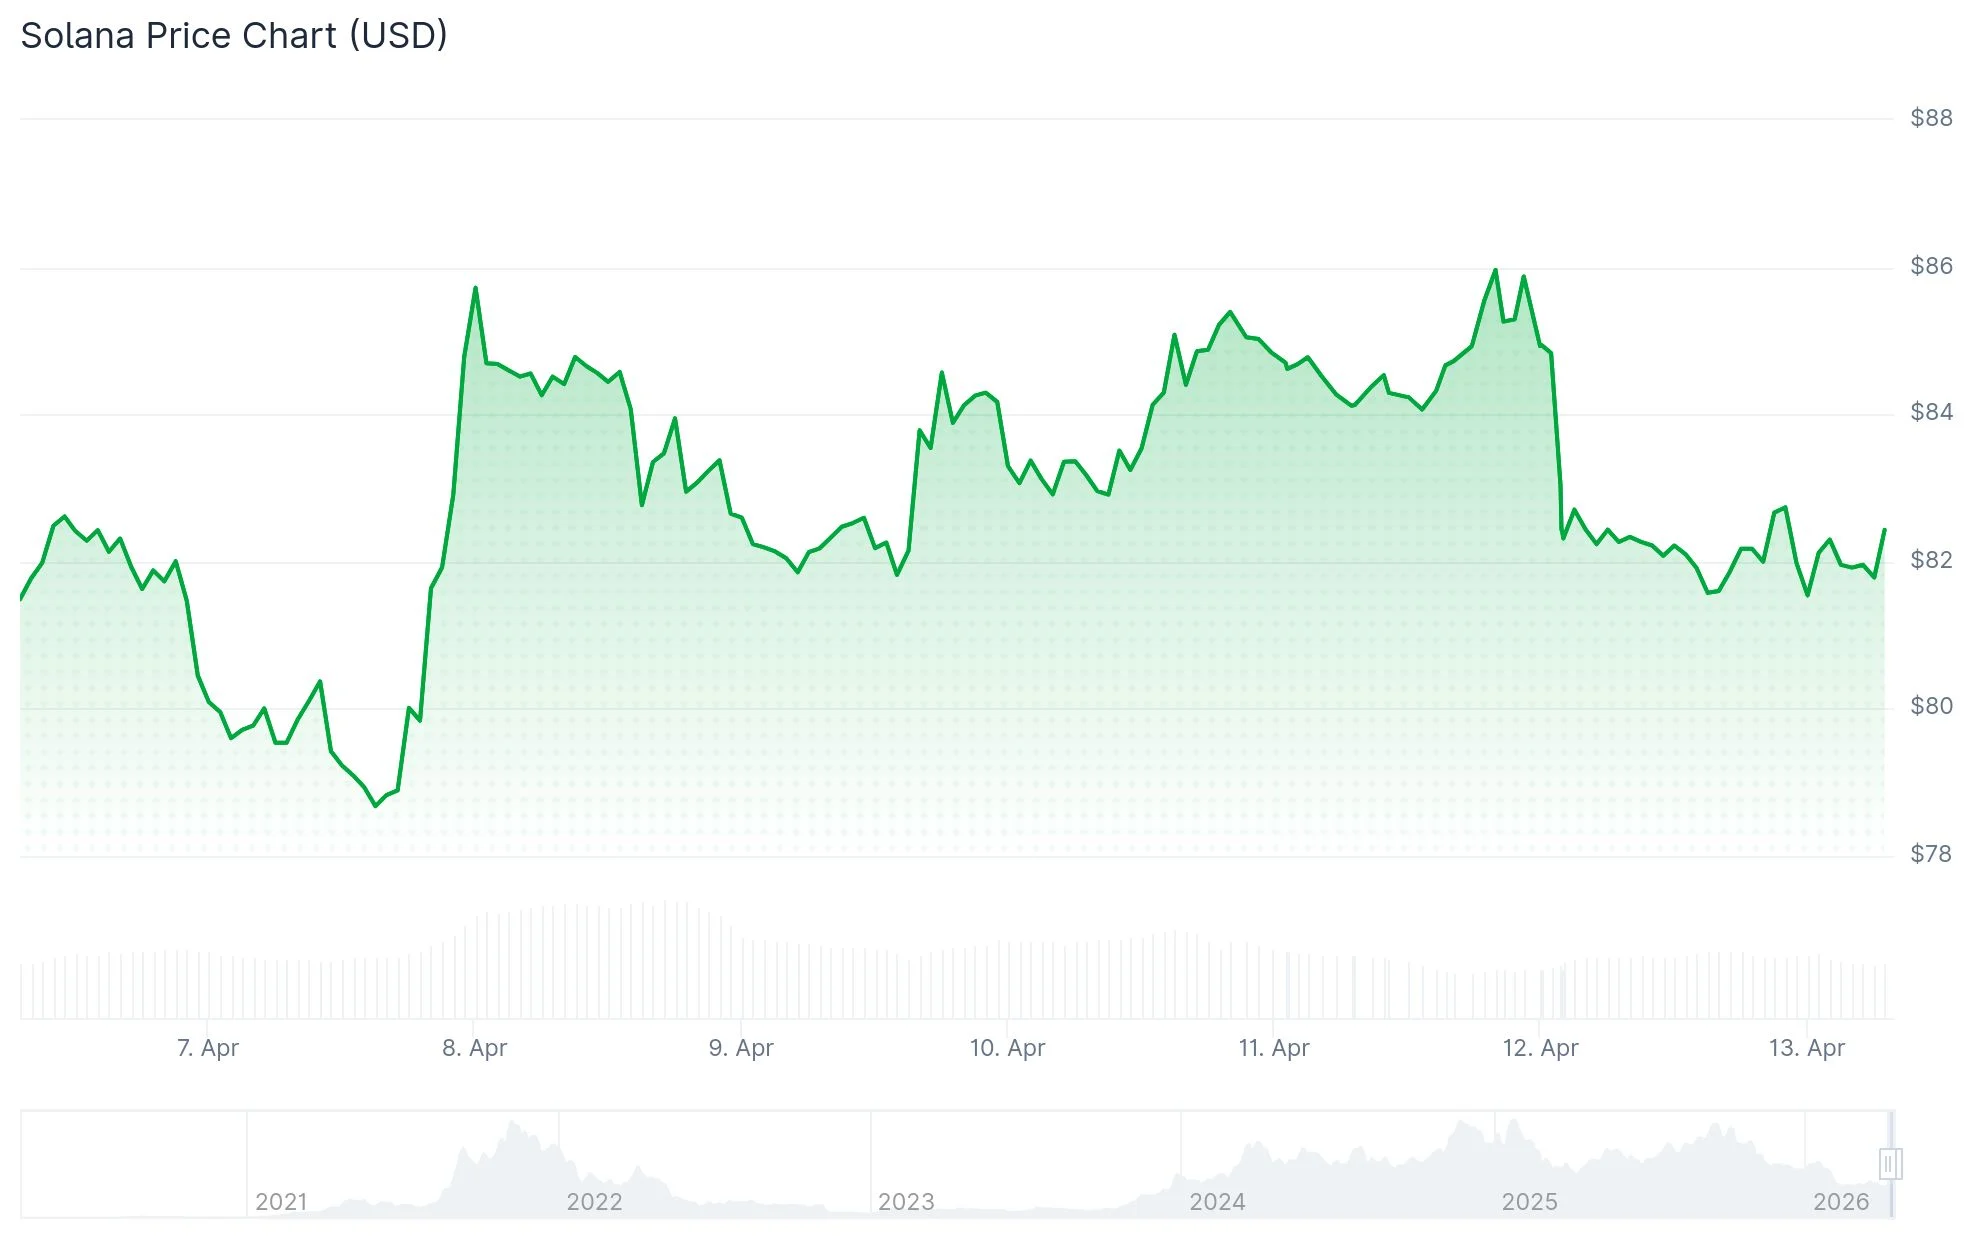
Solana maintains its position near $80 in early weekly trading after experiencing a 4% decline on Sunday. This downward movement coincided with widespread selling pressure across cryptocurrency markets. The digital asset has been confined to a trading range, with bulls unable to overcome critical overhead resistance.
The 50-day exponential moving average currently stands at $87.43, aligning closely with a descending trendline. This confluence has consistently rejected bullish attempts. Higher resistance appears at the 100-day EMA ($99.19) and the 200-day EMA ($118.32), forming additional barriers to upside progression.
According to technical analyst MCO Global’s short-term chart analysis, a methodical recovery path points toward a Fibonacci-derived target zone spanning $88.13 to $90.01. Multiple wave projection scenarios converge on this identical price range, establishing it as the next logical upside destination should the recovery maintain its trajectory.
Downside support is identified between $71.92 and $77.92. The February 5 session low of $77.60 represents the initial critical support level. Should this floor fail, the pathway toward $67.50 would likely open.
Institutional Withdrawal Intensifies Headwinds
Solana exchange-traded funds registered more than $17 million in withdrawals throughout the week. The bulk of this capital flight occurred during early weekly sessions. Friday brought partial relief with $11.45 million in inflows, reducing the net weekly outflow to $5.62 million.


This represents the third consecutive week of negative net flows for Solana ETFs. The persistent outflow trend suggests waning institutional interest in SOL exposure at prevailing price levels.
Derivatives open interest contracted to $4.72 billion on Monday, declining from $4.88 billion during the previous session. Funding rates maintain a marginally positive stance, indicating long position holders continue to outnumber shorts by a narrow margin.
The Relative Strength Index registers below the 50 neutral threshold, signaling subdued buying pressure. The MACD indicator remains beneath zero while displaying preliminary indications of moderating bearish momentum. However, a definitive bullish reversal signal has yet to materialize.
Weekly Timeframe Preserves Four-Figure Bull Scenario
Technical analyst James Easton draws attention to the weekly chart framework, contending that the overarching market structure remains uncompromised. According to his assessment, Solana continues trading within a broad ascending channel and has not violated the larger constructive pattern.
He identifies an ambitious long-term bullish objective at $1,000, contingent upon SOL avoiding a severe breakdown and ultimately recapturing upward momentum. Within this framework, the current price weakness appears more characteristic of consolidation rather than structural failure.
The weekly MACD remains subdued, with momentum indicators not yet displaying bullish rotation. This suggests the extended-timeframe bullish thesis remains viable but requires considerable patience for fruition.
Solana’s current market data confirms price stability just above $80, with the $87-$90 zone representing the immediate focus area for market participants.
Get 3 Free Stock Ebooks
Discover top-performing stocks in AI, Crypto, and Technology with expert analysis.
- Top 10 AI Stocks - Leading AI companies
- Top 10 Crypto Stocks - Blockchain leaders
- Top 10 Tech Stocks - Tech giants


