
 Price Analysis: April 2025 Outlook Amid Hack Fallout and Exchange Inflows")
Quick Overview
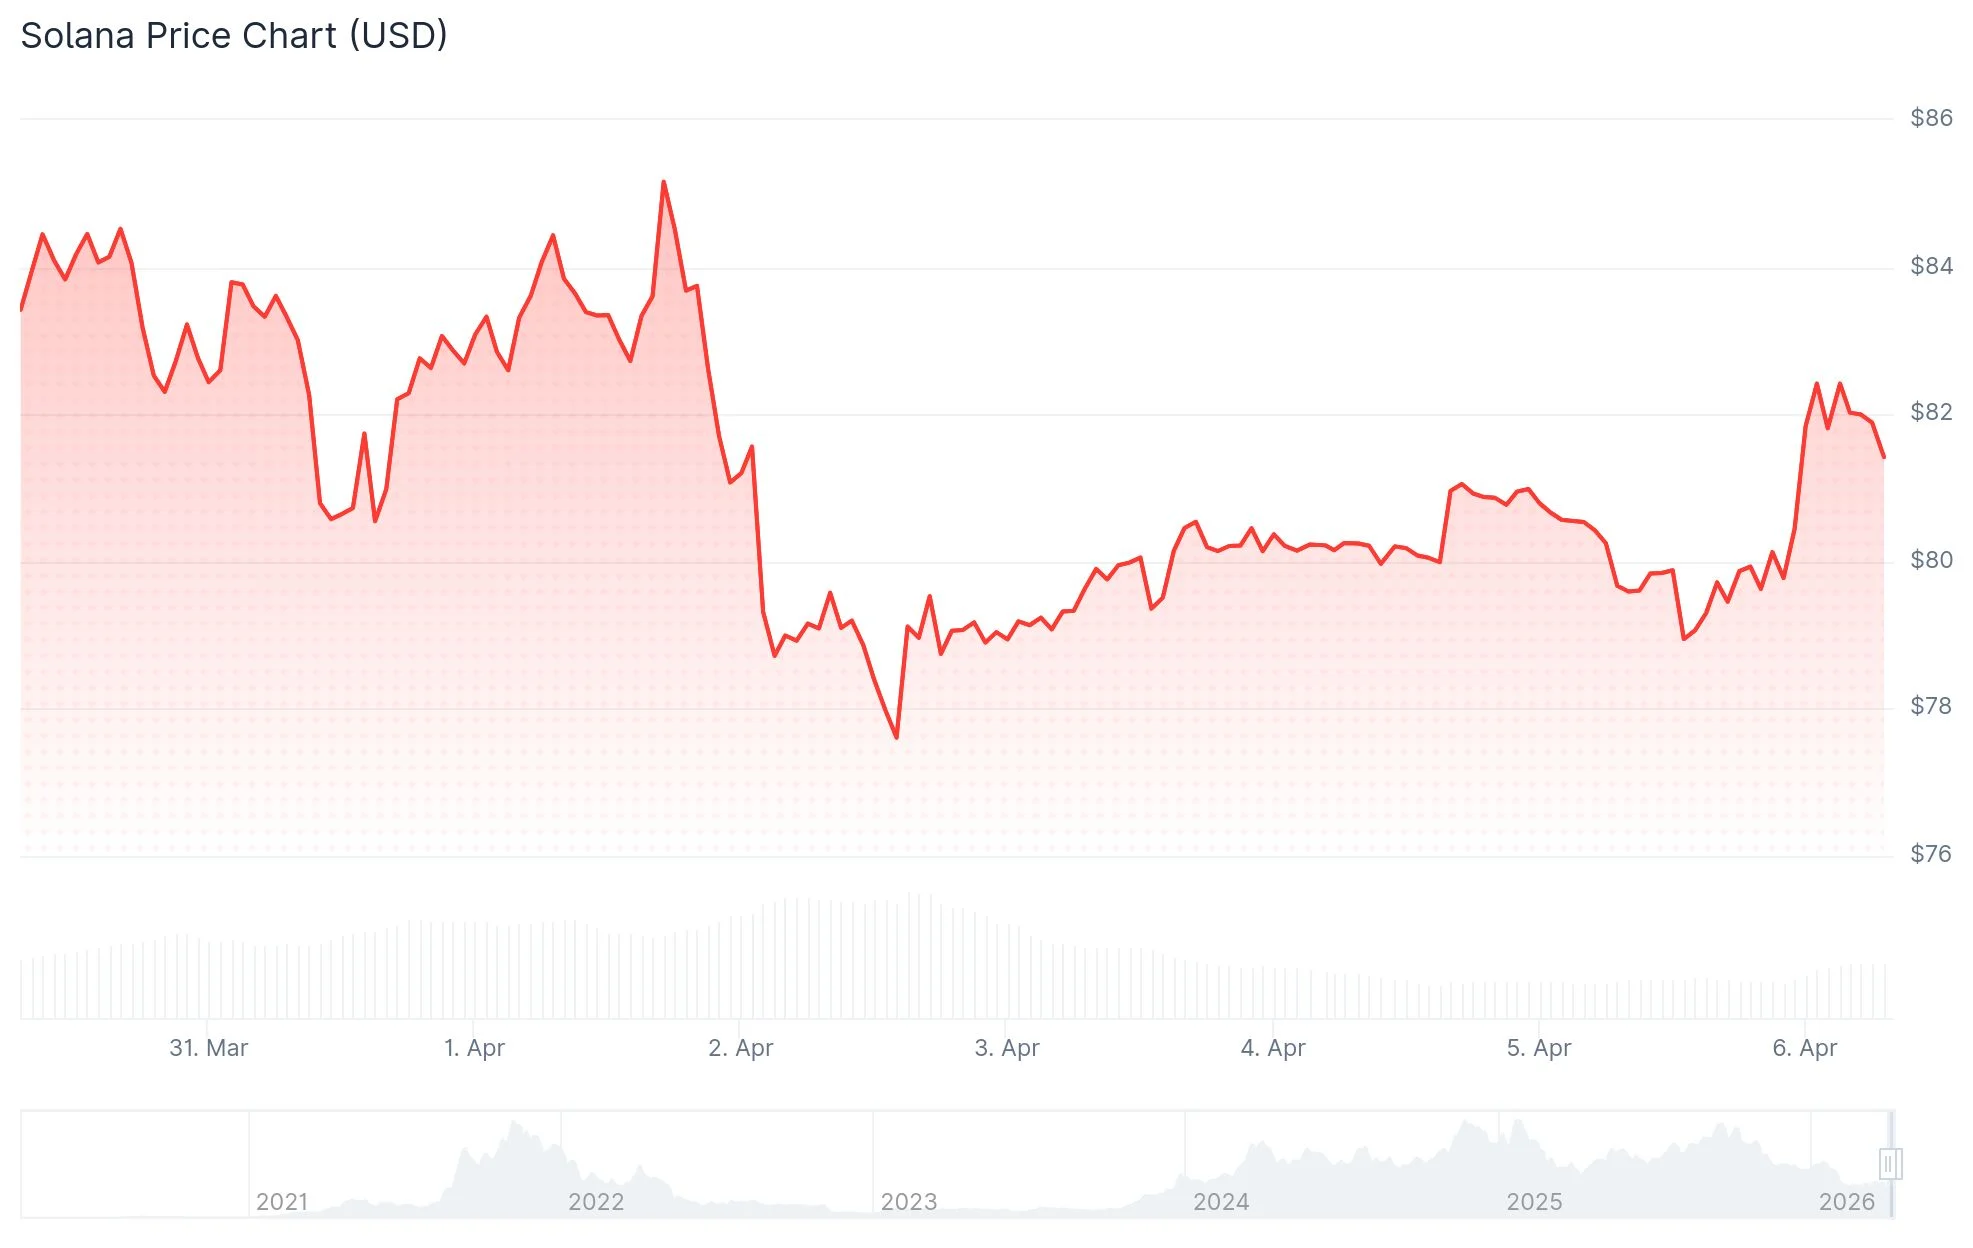
- SOL currently hovers between $78 and $82, with critical support at $75–$78 under pressure
- The Drift Protocol suffered a $285 million security breach that has rattled ecosystem sentiment
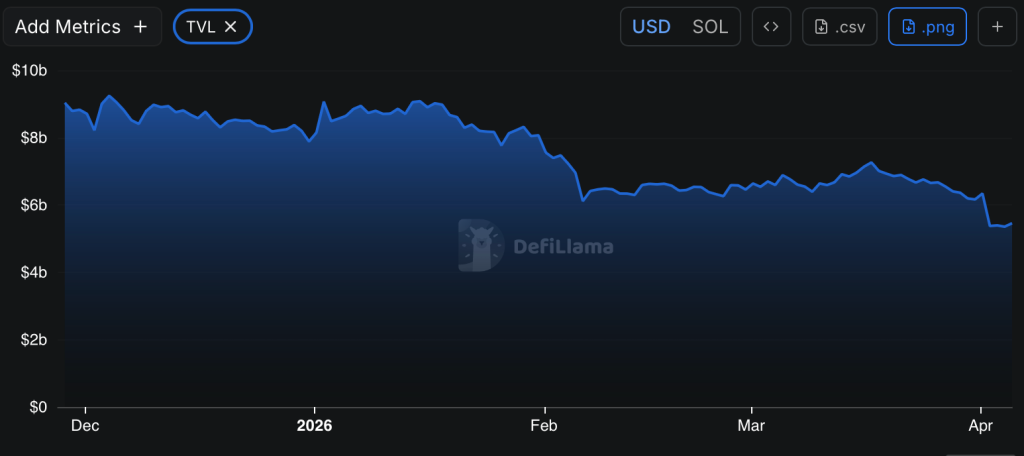
- Total value locked on Solana has contracted from approximately $9 billion to around $5.5–$6 billion
- Exchange deposits increased by 1.40 million SOL (roughly $110 million) within a three-day period
- SOL-based ETFs saw net outflows of $5.24 million for the second week running
Solana faces mounting headwinds following multiple setbacks that have struck the network in rapid succession. At press time, the SOL token has declined approximately 1.5%, with trading activity concentrated in the $78 to $82 range.
The primary catalyst behind recent selling pressure stems from a $285 million security breach targeting Drift Protocol, a decentralized finance platform operating on Solana, which took place on April 1, 2026. Security researchers have connected the incident to North Korean threat actors. In the immediate aftermath, Drift’s total value locked plummeted from $530 million to just $230 million.
This exploit has triggered widespread concern throughout Solana’s DeFi landscape. Market participants are now conducting deeper due diligence on protocol security measures across the ecosystem.
Shrinking Total Value Locked Signals Capital Exodus
According to metrics from DeFiLlama, Solana’s aggregate TVL has contracted from over $9 billion to approximately $5.5–$6 billion in recent trading sessions. This magnitude of decline represents actual capital withdrawal from the network rather than mere price-driven valuation changes.
A falling TVL metric indicates reduced user participation in DeFi protocols and diminished capital deployment. This dynamic creates additional barriers for attracting fresh investment, particularly when market confidence remains fragile.

Blockchain analytics from Glassnode, highlighted by market analyst Ali Charts, reveal that 1.40 million SOL tokens valued at approximately $110 million were transferred to centralized exchanges during a 72-hour timeframe. Exchange-held balances rose from 26.5 million SOL on March 31 to 28.6 million by April 2. While elevated exchange balances often precede selling activity, they don’t guarantee immediate liquidation.
Critical Technical Thresholds in Focus
Solana is presently challenging a support band spanning $75 to $78. While this price zone has provided buying interest previously, successive retests without meaningful rebounds typically erode support strength.
The Relative Strength Index currently registers at 44, positioned beneath the neutral threshold, while the MACD indicator remains in bearish territory. These technical readings suggest weakening upside momentum. The 50-day exponential moving average stands at $88.80, representing the initial resistance barrier SOL must reclaim to establish a sustainable recovery trajectory.
Market analyst Crypto Patel published a longer-term technical framework illustrating SOL positioned near a Fibonacci retracement support corridor between $61.75 and $42.62. The analysis identifies this region as a potential accumulation zone should current levels maintain, drawing parallels to SOL’s previous 2,194% advance from 2022 lows. Crypto Patel emphasized, however, that projected targets exceeding $1,000 remain speculative scenarios rather than confirmed price objectives.
ETF flow data from Sosovalue indicates net weekly redemptions totaling $5.24 million from SOL-based exchange-traded products, representing the second consecutive week of capital outflows. Institutional appetite appears subdued in the current environment.
Get 3 Free Stock Ebooks
Discover top-performing stocks in AI, Crypto, and Technology with expert analysis.
- Top 10 AI Stocks - Leading AI companies
- Top 10 Crypto Stocks - Blockchain leaders
- Top 10 Tech Stocks - Tech giants


