
 Price Alert: 800% Spike in Exchange Inflows Points to $65 Target")
Key Takeaways
- Year-to-date losses exceed 30% for SOL, with consecutive rallies forming progressively lower peaks throughout 2026
- Persistent negative funding rates for 21 consecutive weeks echo 2022 dynamics that preceded a substantial price surge
- Derivatives open interest plummeted from $7.58 billion to $1.9 billion, eliminating potential short squeeze catalysts
- Daily exchange deposits exploded 800% from late February, climbing from 245,691 SOL to 2.2 million SOL
- Critical price floors established at $82 and $75, with analysts eyeing $65 as next destination if support crumbles
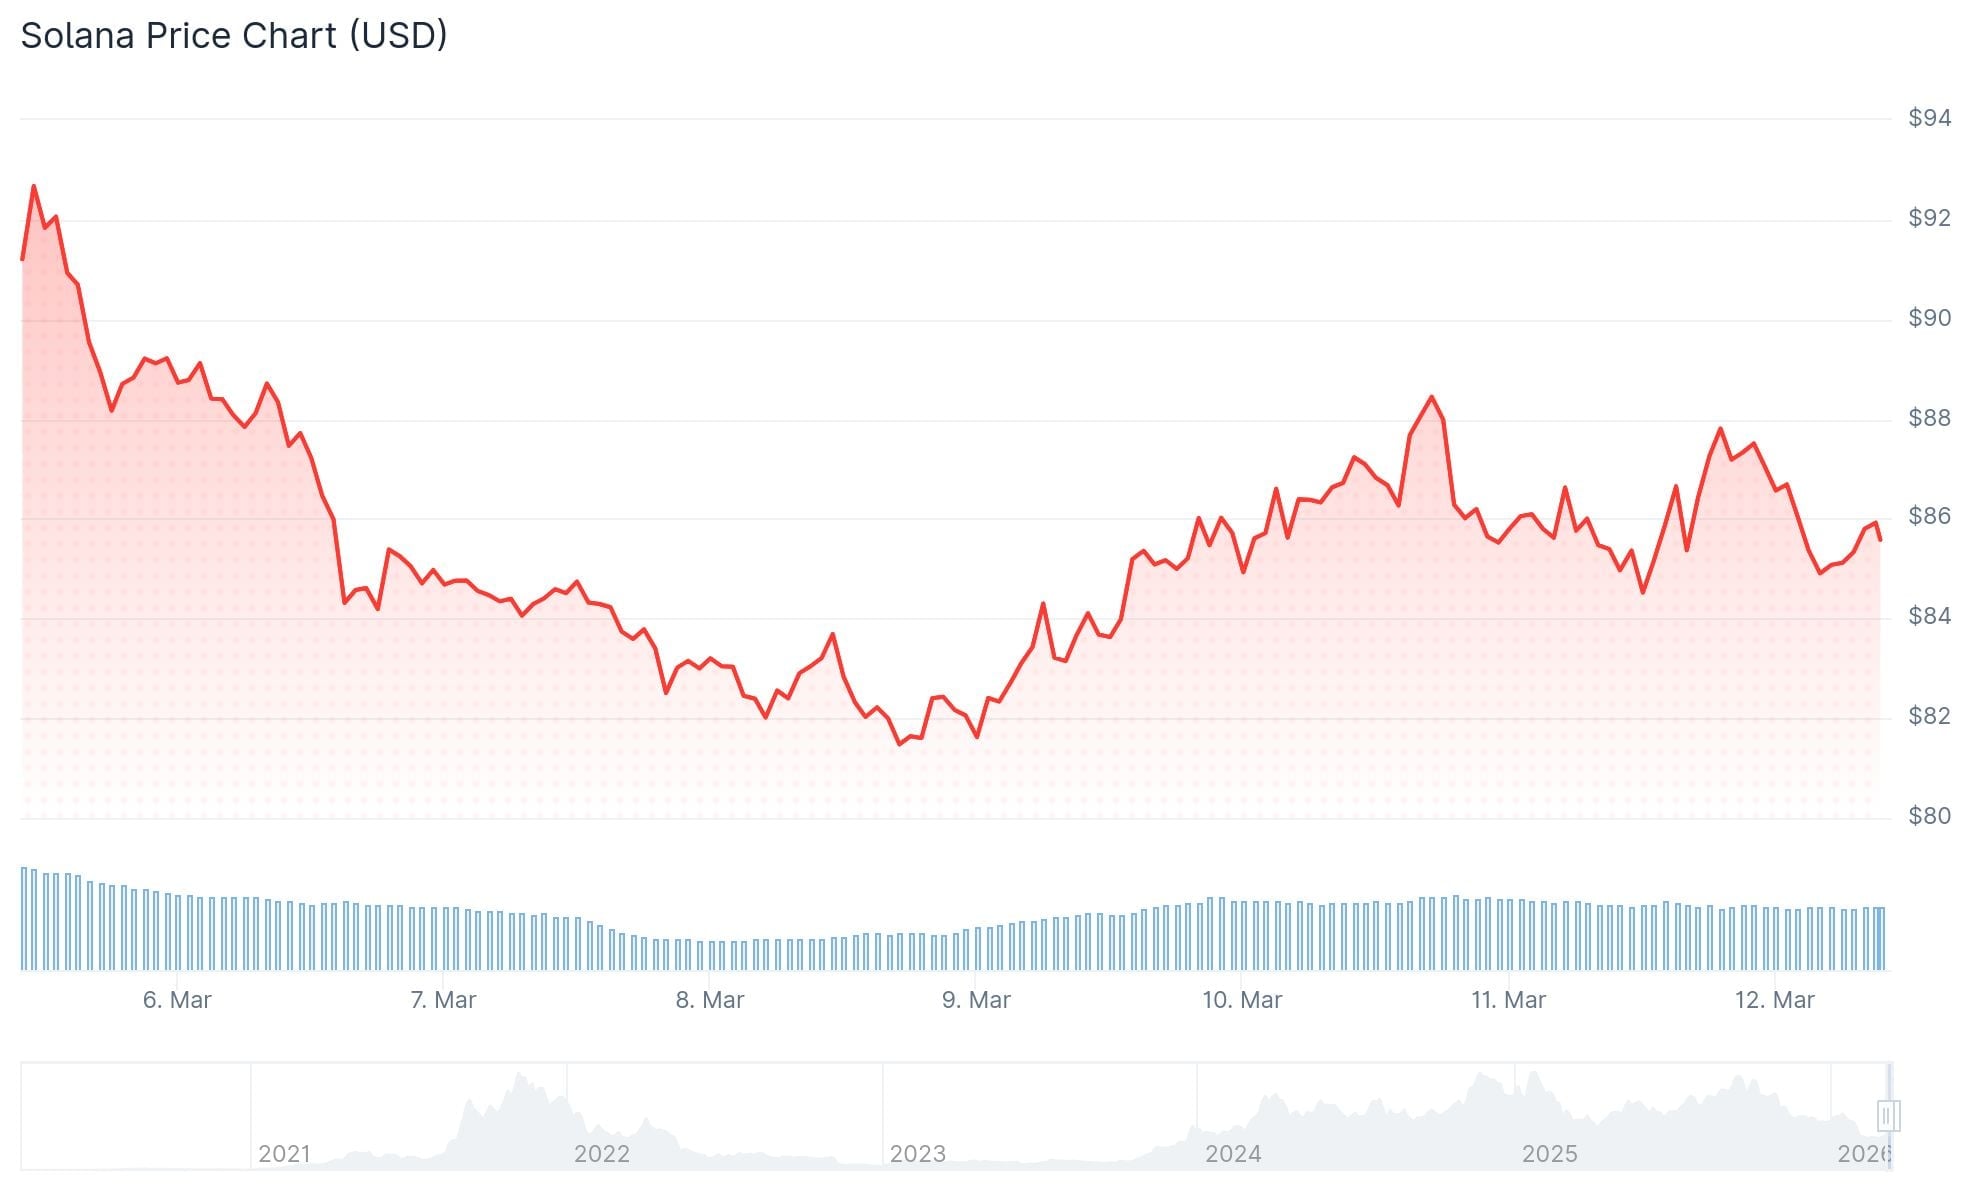
While Solana has displayed relative stability across the last month with only a 1.4% decline, zooming out reveals a concerning trajectory. Since the start of 2026, SOL has hemorrhaged over 30% of its value, with every upward attempt meeting resistance at progressively weaker levels.
Beneath this superficial short-term stability, significant bearish forces are accumulating momentum.
A critical indicator from the derivatives market — the funding rate — has remained in negative territory for an unbroken 21-week period. When funding rates turn negative, short position holders compensate long traders for maintaining their exposure. This dynamic reveals that pessimistic sentiment is overwhelming the market.
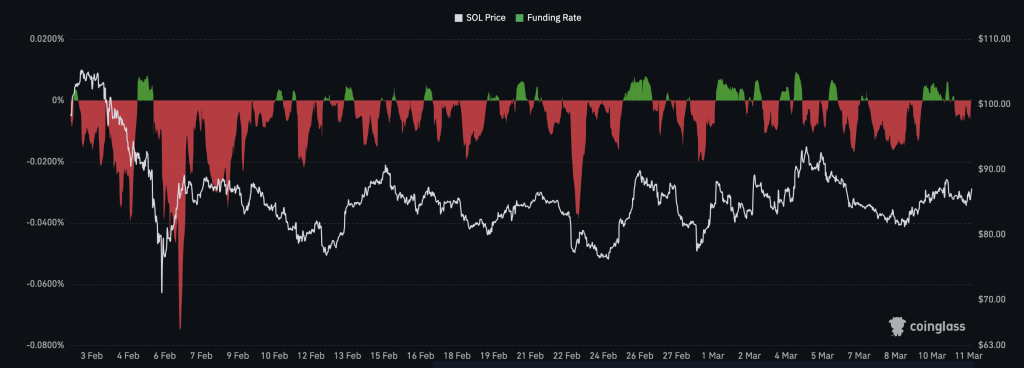
Historical precedent exists for this configuration. Between February 2022 and February 2023, SOL experienced a 53-week run of negative funding rates. Throughout that period, the token plunged to a cycle bottom at $7. However, as that extended streak concluded, price action quietly shifted upward — ultimately surging to $209 by March 2024.
The present 21-week pattern displays structural similarities to that earlier phase. A crucial distinction exists, however.

Derivatives Market Shows Dramatic Contraction
SOL derivatives open interest reached its zenith at $7.58 billion in September 2025. Current levels hover around $1.9 billion — marking the weakest reading since early March 2025. This represents an approximate 75% evaporation of market positioning.
Diminished open interest indicates insufficient leveraged short exposure to catalyze a significant squeeze scenario. Without this potential energy, price recoveries typically lack staying power.
From a technical perspective, SOL has been confined within an ascending channel formation since early February. While this might suggest recovery momentum, the channel emerged immediately following a brutal decline from $148 down to $68. Market technicians interpret this as a bearish continuation structure — rather than a bullish reversal signal.

Blockchain Data Reveals Mounting Sell Pressure
On-chain metrics reinforce the bearish narrative. Net Solana deposits to exchanges have registered positive readings continuously since February 10. On that initial date, approximately 245,691 SOL flowed into exchanges daily. By March 10, this figure had exploded to 2,204,783 SOL — representing an extraordinary 800% surge within a single month.
When tokens migrate toward exchanges in volume, it generally indicates holders are positioning for liquidation.
For a genuine market bottom to establish itself, analysts emphasize these inflows must reverse into consistent outflows. That transition has yet to materialize.
Technical support zones are established at $82, followed by $79. Should these levels fail, the projected move based on channel geometry targets the $65 region.
Regarding upside potential, a daily candle close exceeding $94 would disrupt the pattern of descending peaks. A breakthrough above $118 would be required to validate a complete trend reversal toward bullish momentum.
As of March 11, 2026, SOL is changing hands near $85, with exchange inflows continuing their upward trajectory and open interest languishing near multi-month depths.
Get 3 Free Stock Ebooks
Discover top-performing stocks in AI, Crypto, and Technology with expert analysis.
- Top 10 AI Stocks - Leading AI companies
- Top 10 Crypto Stocks - Blockchain leaders
- Top 10 Tech Stocks - Tech giants


