
 Plunges 5% as Geopolitical Tensions Strike Crypto Markets")
TLDR
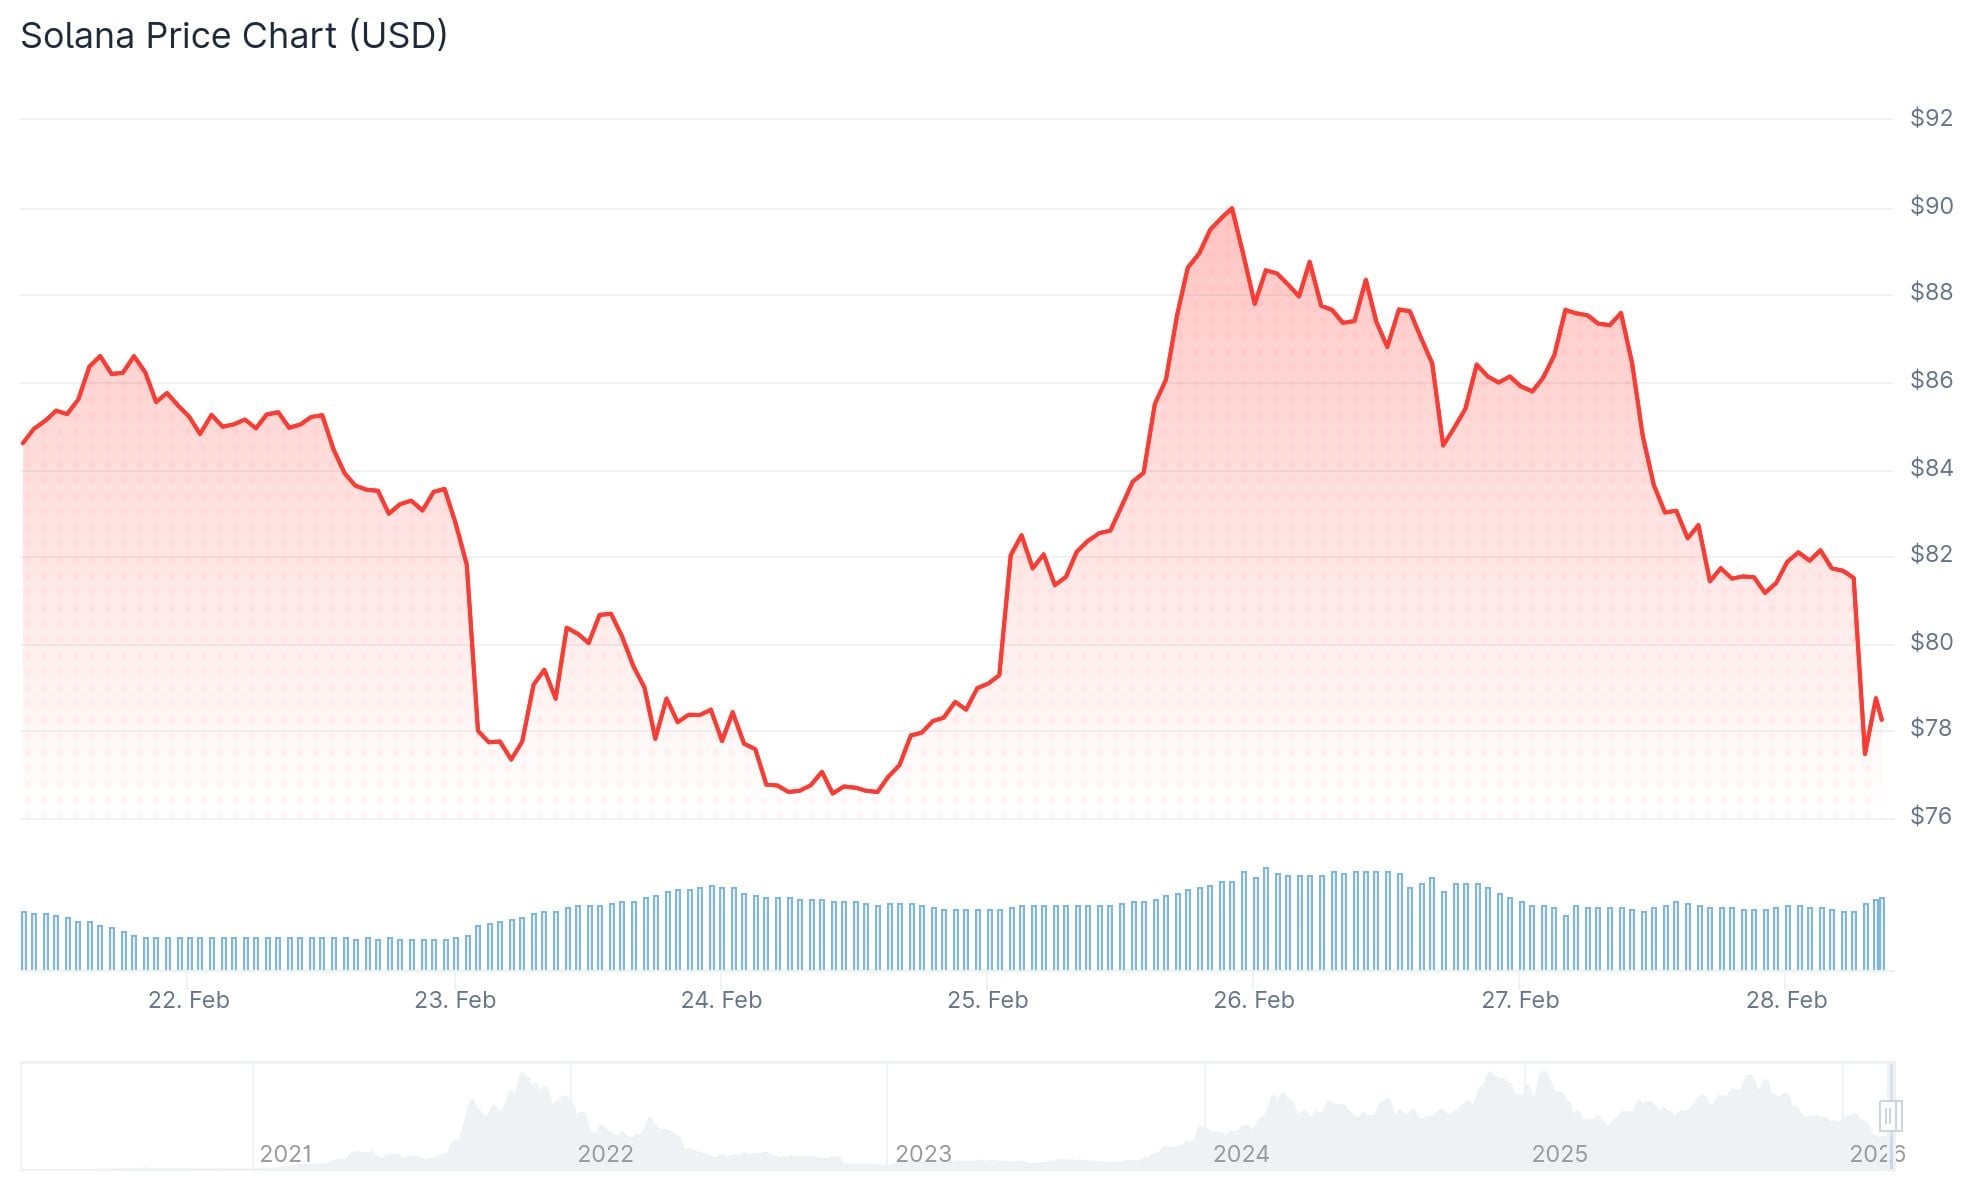
- Solana’s native token has fallen 72% from its all-time high of $295, currently hovering around $78
- SOL’s exchange-traded fund products show minimal outflows of just $11.3M total, contrasting sharply with Bitcoin and Ethereum ETFs that saw four consecutive months of net negative flows
- The Solana blockchain led decentralized exchange trading with $108 billion in monthly volume, eclipsing Ethereum’s $63.7 billion
- Chart analysts have pinpointed essential support levels at $50, $22, and $10 based on Parallel Channel technical patterns
- Escalating military conflict between Israel and Iran triggered mass crypto liquidations, pushing Bitcoin toward $60,000 and pressuring altcoins like SOL
Solana’s SOL token currently trades at $78, marking a steep 72% pullback from its all-time high of $295. This significant decline aligns with broader cryptocurrency market turbulence amplified by heightened geopolitical tensions on February 28, 2026.
Early Saturday morning saw Israeli military forces launching strikes on Iranian installations. According to AP intelligence sources, the United States participated in these coordinated operations. Bitcoin tumbled 5% within moments, nearing the $60,000 level, with the ensuing selloff spreading rapidly to alternative cryptocurrencies including SOL.
Despite bearish price movements, Solana’s underlying network fundamentals showcase remarkable strength. The platform registered $108 billion in decentralized exchange trading volume over the last 30 days, significantly surpassing Ethereum’s $63.7 billion and Base’s $31.48 billion.
Over the most recent 24-hour period, Solana-based applications generated $3.1 million in protocol fees versus Ethereum’s $2.95 million. The blockchain supported 2.17 million active addresses, considerably outpacing Ethereum’s 682,236 active users.
The real-world asset tokenization sector on Solana has reached a record $1.71 billion valuation, reflecting 45% growth over the preceding month.

SOL ETF Flows Remain Resilient
SOL exchange-traded fund products launched in late October 2025, drawing over $100 million in average daily net inflows during their first five weeks. Weekly capital flows have since stabilized in the $20–$25 million range amid declining token prices.
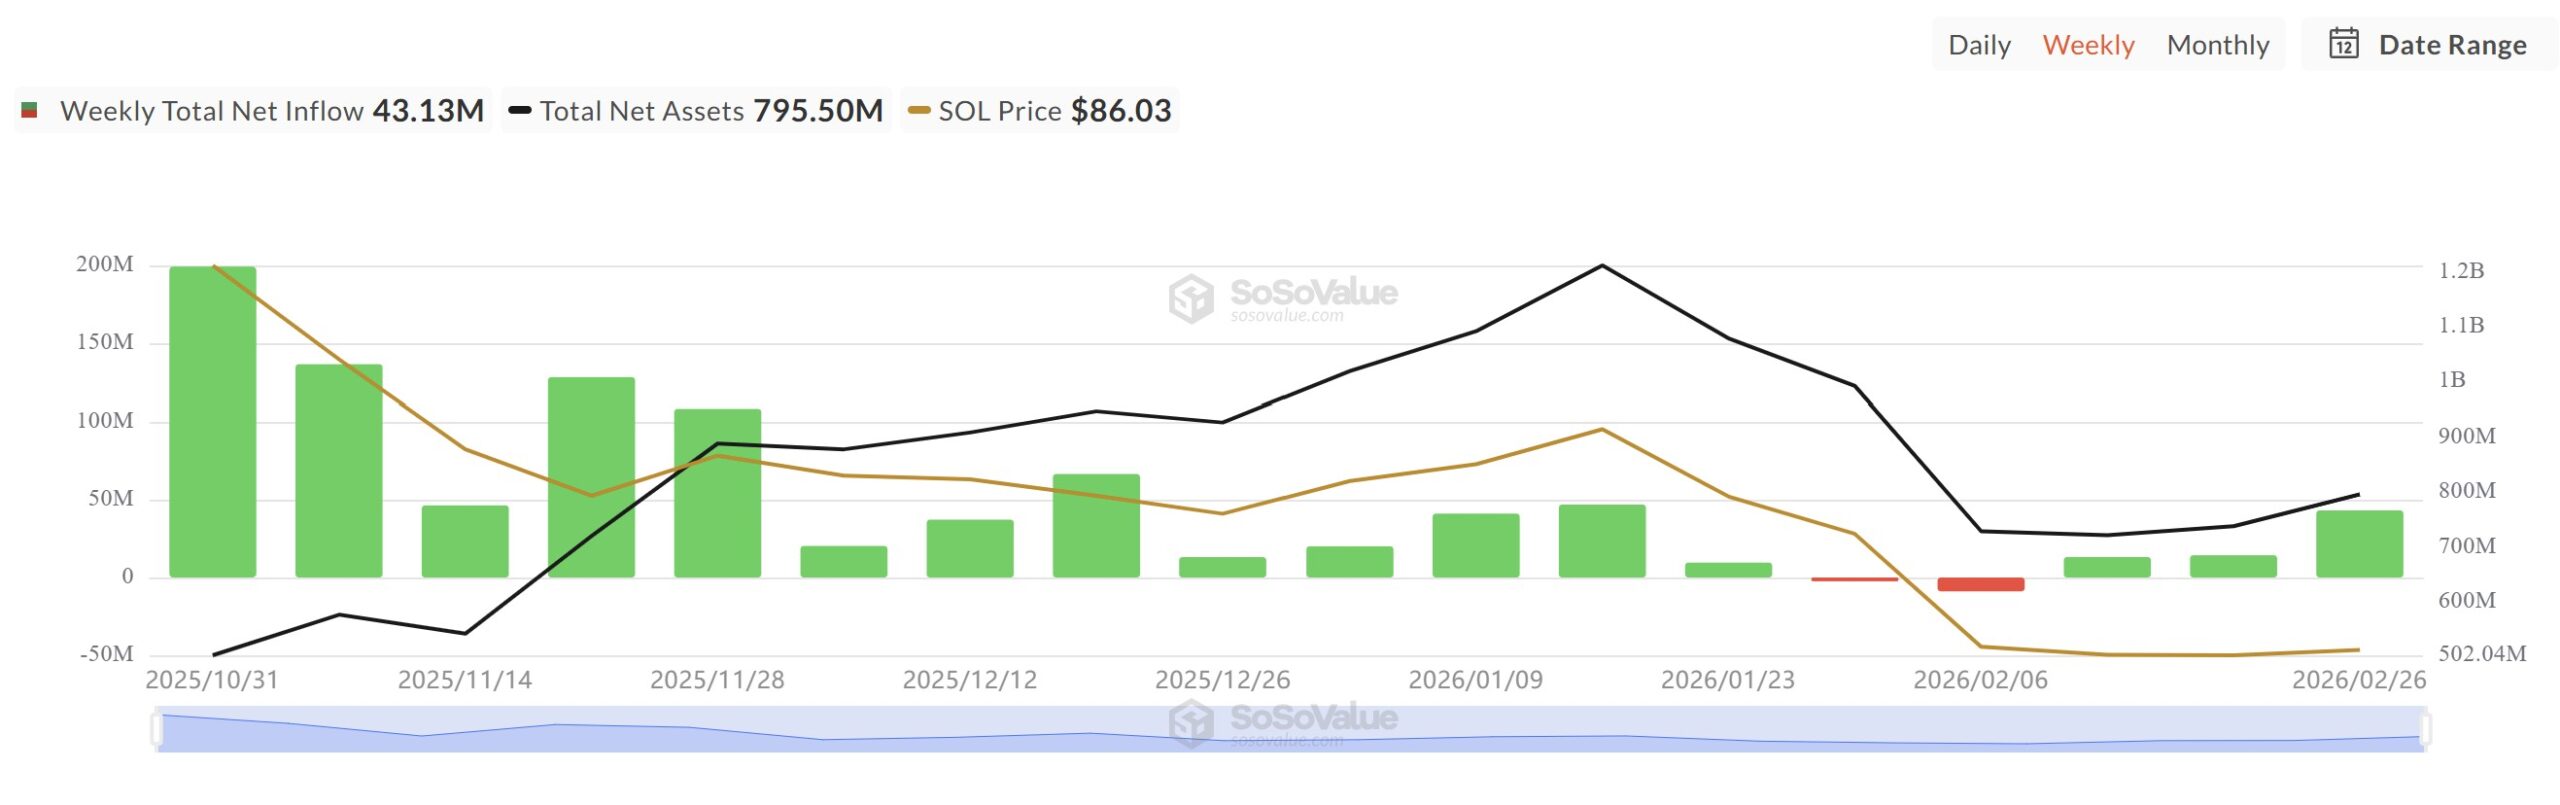
Cumulative outflows during the four-month correction period total only $11.3 million across a two-week window. By contrast, Bitcoin and Ethereum ETF vehicles experienced four straight months of net withdrawals during the same period.
Solana currently trades well below the $188 price point recorded when its ETF products launched.
Critical Support Zones Under Observation
Technical analyst Ali Martinez has detected a Parallel Channel pattern forming on SOL’s weekly timeframe. This configuration points to potential support levels at $50.22, $22.47, and $9.98.
Crypto analyst Scient has highlighted two additional zones of interest. The first corresponds to the 0.75 Fibonacci retracement spanning $60 to $70. The second represents a weekly demand fair value gap between $22 and $29.
Glassnode’s UTXO data reveals that more than 6% of SOL’s circulating supply last moved at current price levels. The next major supply cluster, exceeding 3%, sits between $20 and $30.
SOL remains below the weekly resistance level of $120. The $51 to $80 range on weekly charts has been tested multiple times and aligns with the retracement zone analysts are monitoring.
As of February 28, 2026, SOL held at $78 while cryptocurrency markets processed implications from the Israel-Iran military escalation.
Get 3 Free Stock Ebooks
Discover top-performing stocks in AI, Crypto, and Technology with expert analysis.
- Top 10 AI Stocks - Leading AI companies
- Top 10 Crypto Stocks - Blockchain leaders
- Top 10 Tech Stocks - Tech giants


