
 Faces Mounting Pressure After $93 Resistance Rejection")
Key Takeaways
- SOL encountered strong rejection at $93 and declined 5.7% over 24 hours to approximately $87
- The cryptocurrency trades beneath its 20-, 50-, 100-, and 200-day moving averages
- Technical indicators (RSI, MACD) reflect weakening price momentum
- A developing bearish flag formation on daily charts suggests potential downside to $40–$45 range
- Network activity remains robust with Solana handling 44% of worldwide crypto transactions
Solana (SOL) faces mounting selling pressure following an unsuccessful attempt to breach the $93 resistance threshold. The cryptocurrency has retreated and currently hovers near a critical support level that market participants are monitoring intensely.
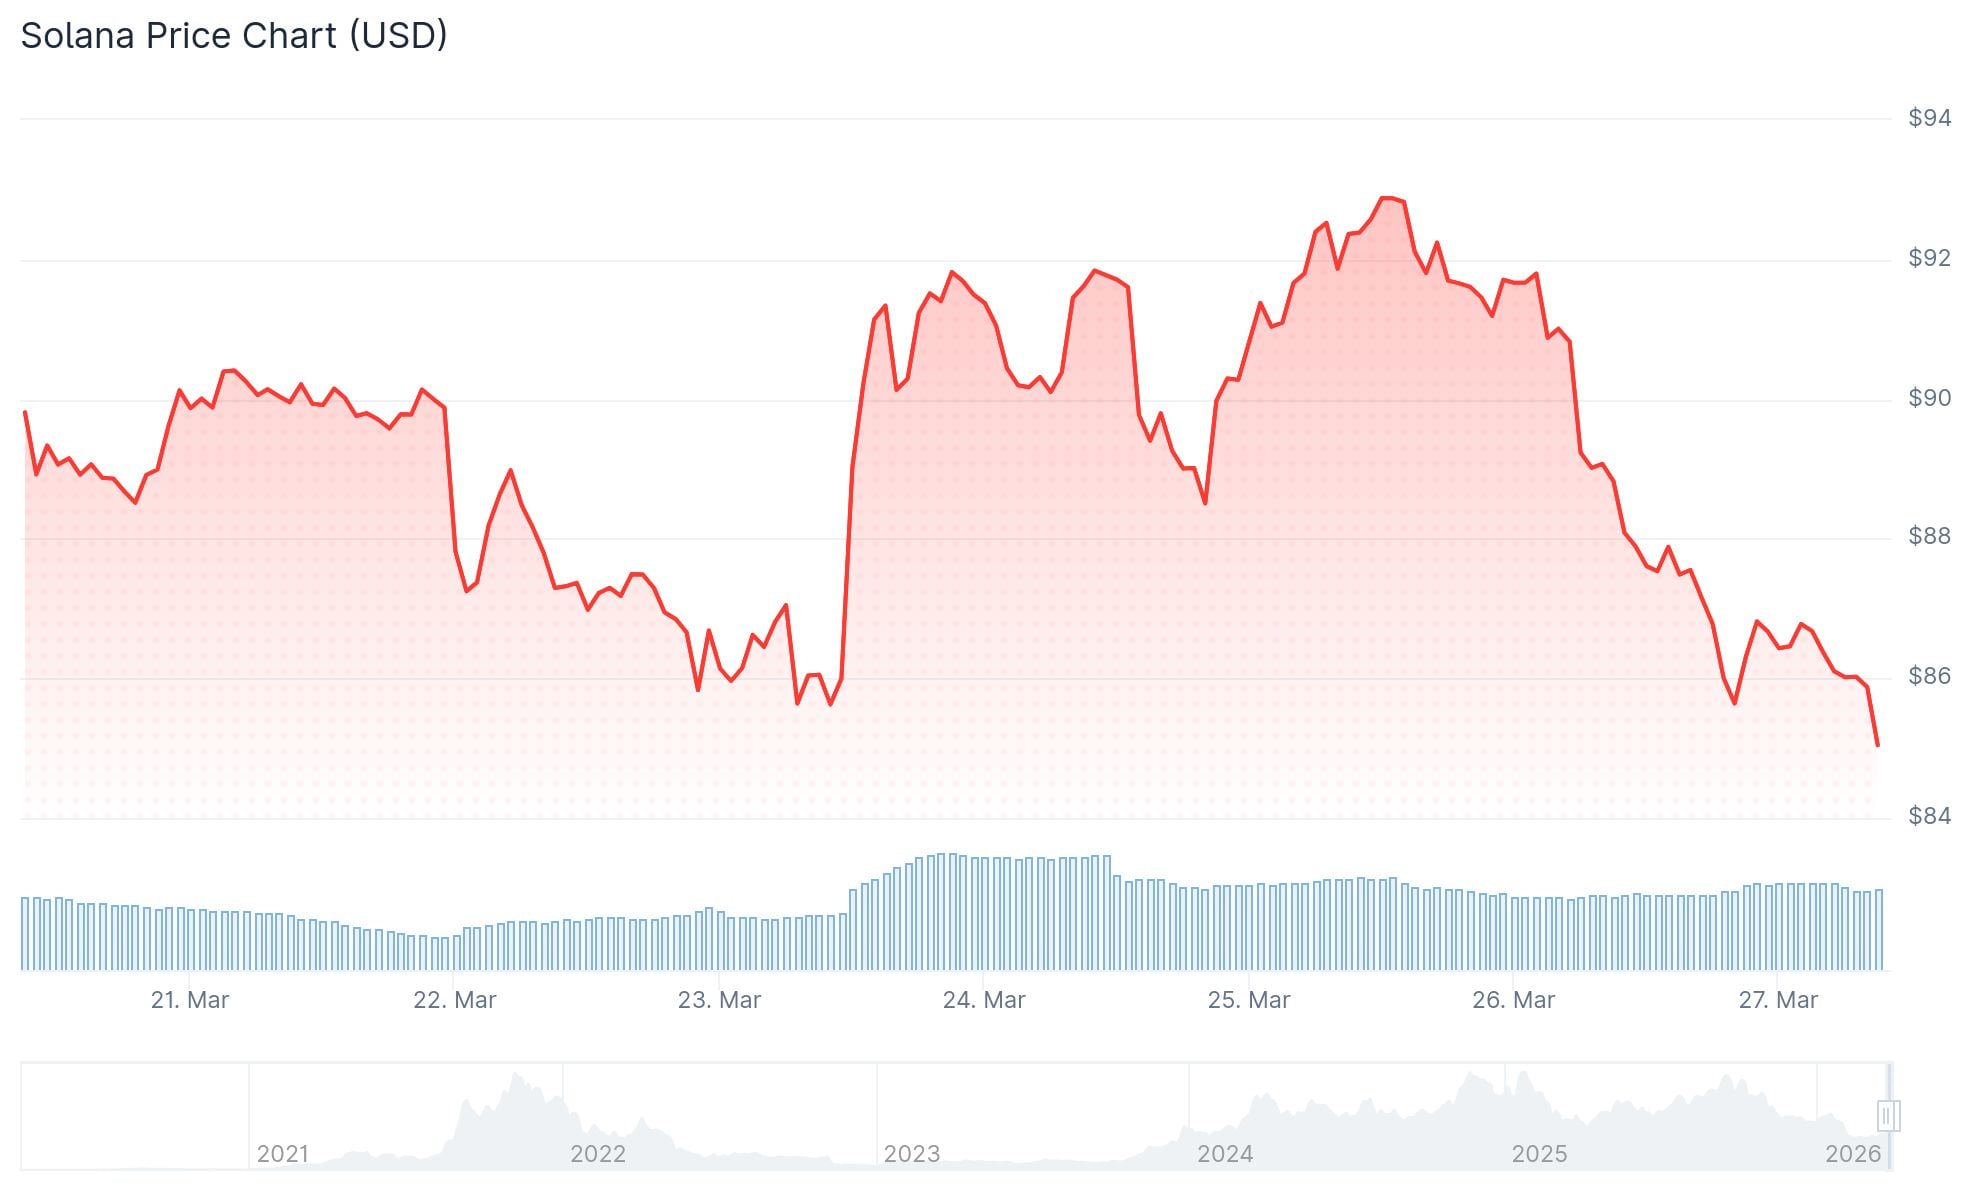
As of this writing, SOL changes hands at $87.45. The asset registered $5.62 billion in trading volume during the previous 24-hour period, with its market capitalization standing at $50.21 billion. Price action shows a 5.70% decline over the past day.
The failure to break above $93 was highlighted by cryptocurrency analyst BitGuru through a March 26, 2026 post on X. The analyst noted that SOL has retreated to a historically significant support area following the resistance rejection. The price behavior at this critical juncture may determine the next directional move.
Should buying interest emerge at current levels, SOL might stage a recovery toward upper resistance zones. Conversely, a breach of this support area could trigger additional downward movement.
Technical Indicators Point to Deteriorating Momentum
Solana currently trades beneath all primary moving average benchmarks. The 20-day moving average registers at $88.63, while the 50-day stands at $86.09, the 100-day rests at $106.54, and the 200-day marks $143.24.

Trading below both the 100- and 200-day moving averages indicates the asset remains distant from establishing sustained upward momentum.
The Relative Strength Index reads 47.66, positioned below its signal line at 52.54. The MACD line registers 0.127, beneath its signal line of 0.232. The relatively flat MACD histogram suggests minimal directional conviction from market participants.
Bearish Flag Formation Indicates Downside Potential
Chart analysis reveals a developing bearish flag pattern on daily timeframes — a technical structure resembling one observed earlier in the year. In that previous instance, Solana experienced a significant downward breakout following pattern completion.
The present formation displays price consolidation within an ascending channel following a substantial decline. Should a confirmed breakdown materialize from present levels, technical projections indicate potential movement toward the $40 to $45 price zone within a one to two-week timeframe.
Despite technical headwinds, Solana’s blockchain performance remains impressive. The network executed 825,729,338 transactions from a total of 1,867,616,231 blockchain transactions during the observation period — representing 44% of all worldwide cryptocurrency transaction volume.
Cryptocurrency analyst Ali Charts observed via X that more than 100 million SOL tokens changed hands between $91.45 and $82.60, identifying this as the most significant demand area. Below this zone, important support levels include $53.10, $35.40, and $23.60.
Get 3 Free Stock Ebooks
Discover top-performing stocks in AI, Crypto, and Technology with expert analysis.
- Top 10 AI Stocks - Leading AI companies
- Top 10 Crypto Stocks - Blockchain leaders
- Top 10 Tech Stocks - Tech giants


