
 Consolidates Near $85: Will the Month-Long Range Finally Break?")
TLDR
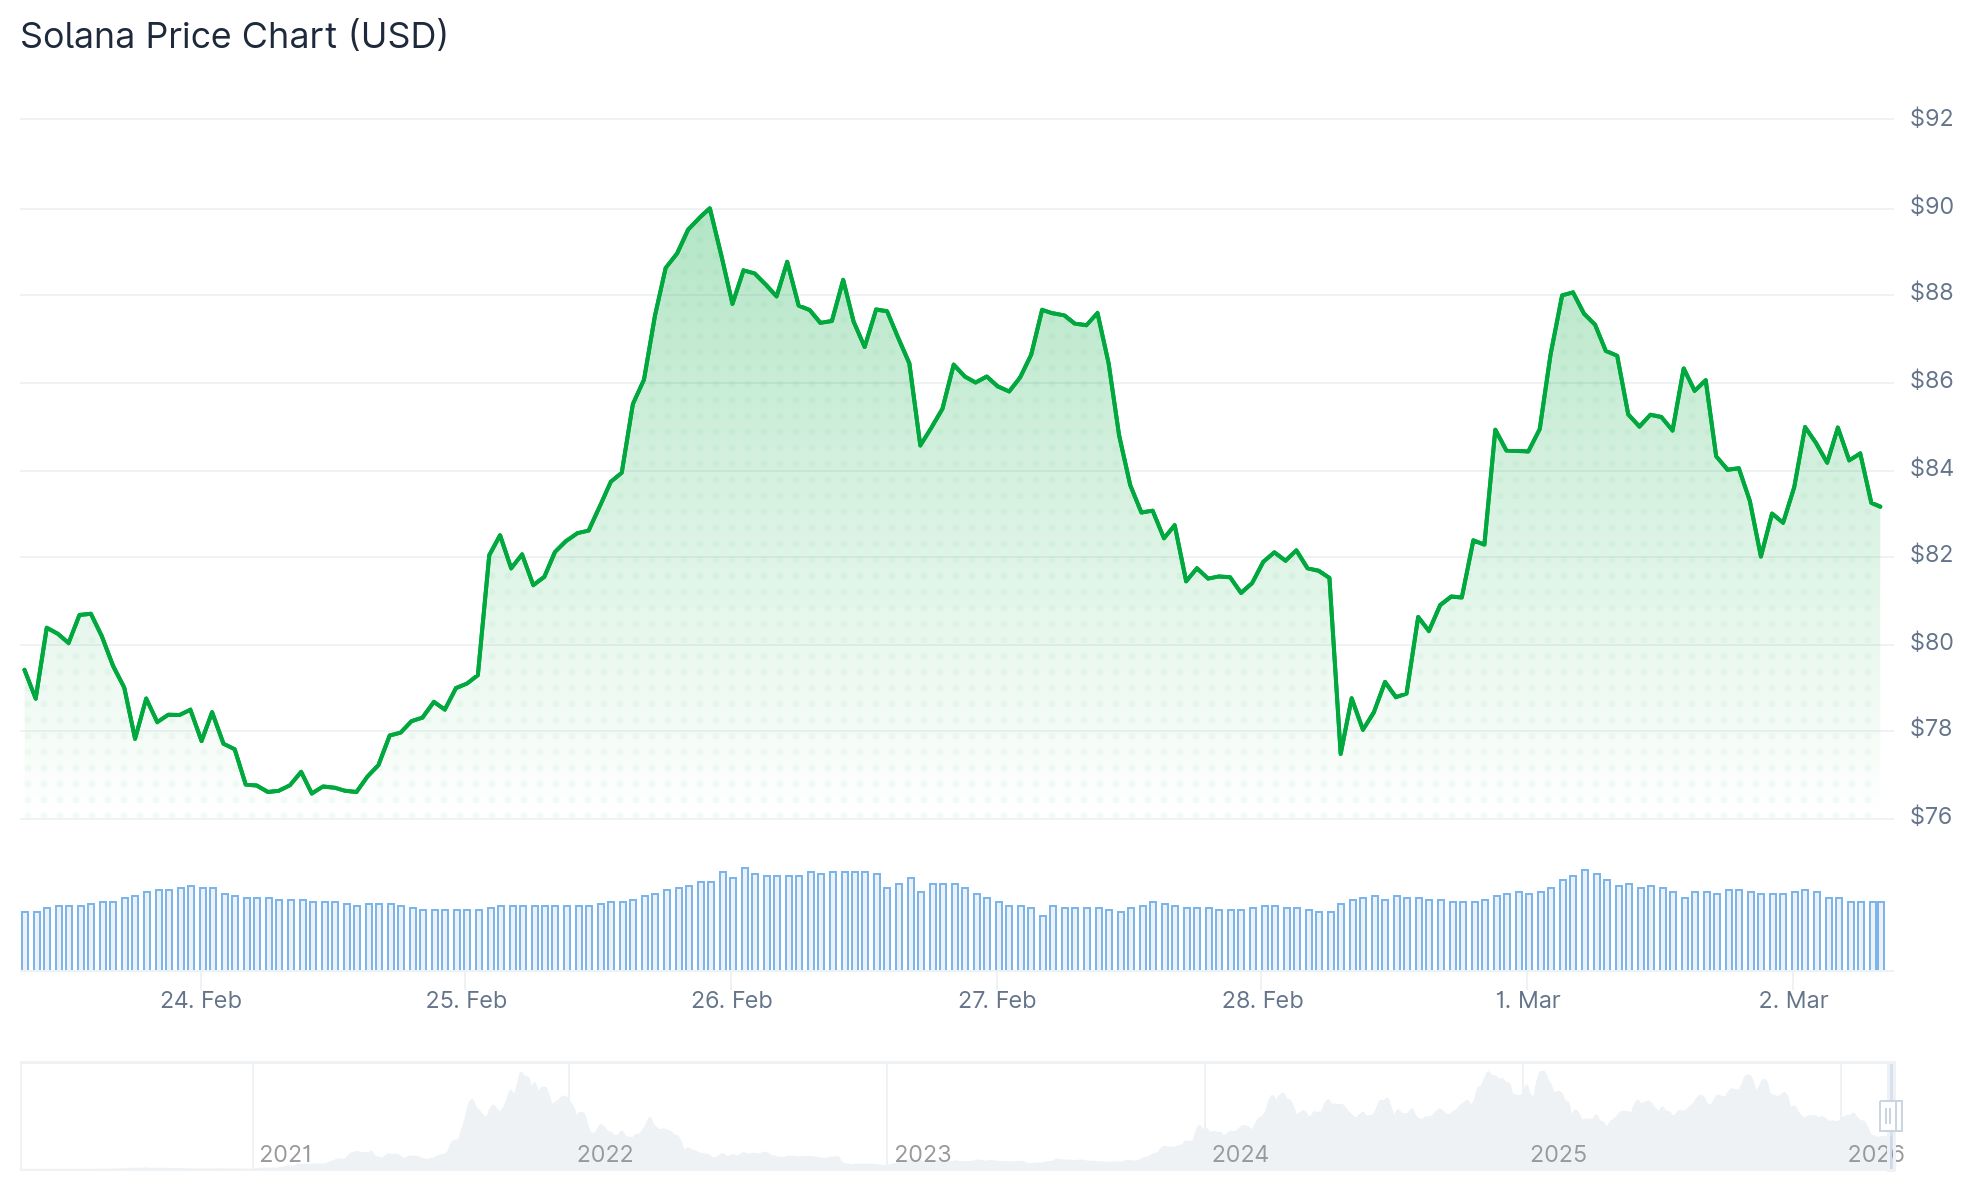
- Solana (SOL) remains confined within a narrow $77–$88 trading corridor for approximately four weeks without establishing a clear directional bias
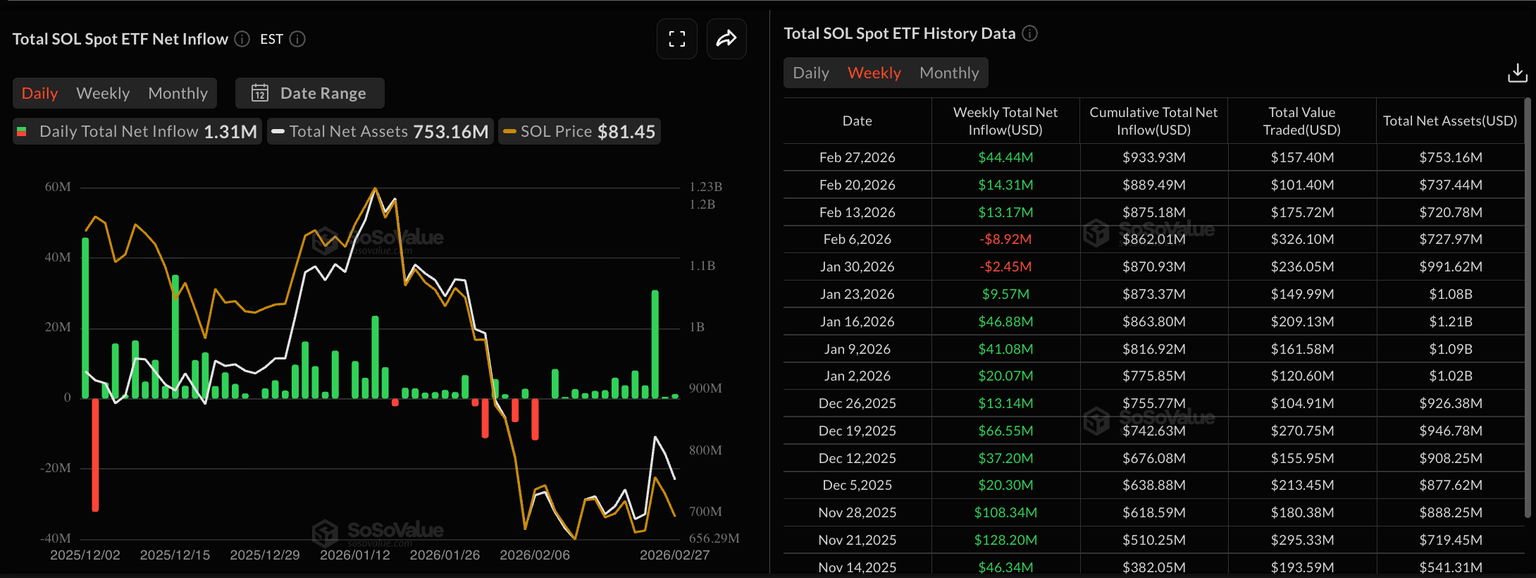
- Spot Solana ETFs in the United States attracted more than $44 million in net inflows last week, pushing total accumulated inflows beyond $900 million
- Futures Open Interest for SOL declined by more than 6% within a 24-hour period, accompanied by $26.47 million in liquidations dominated by leveraged long positions
- Technical analysis reveals Bollinger Bands tightening, suggesting an impending volatility expansion could trigger movement in either direction
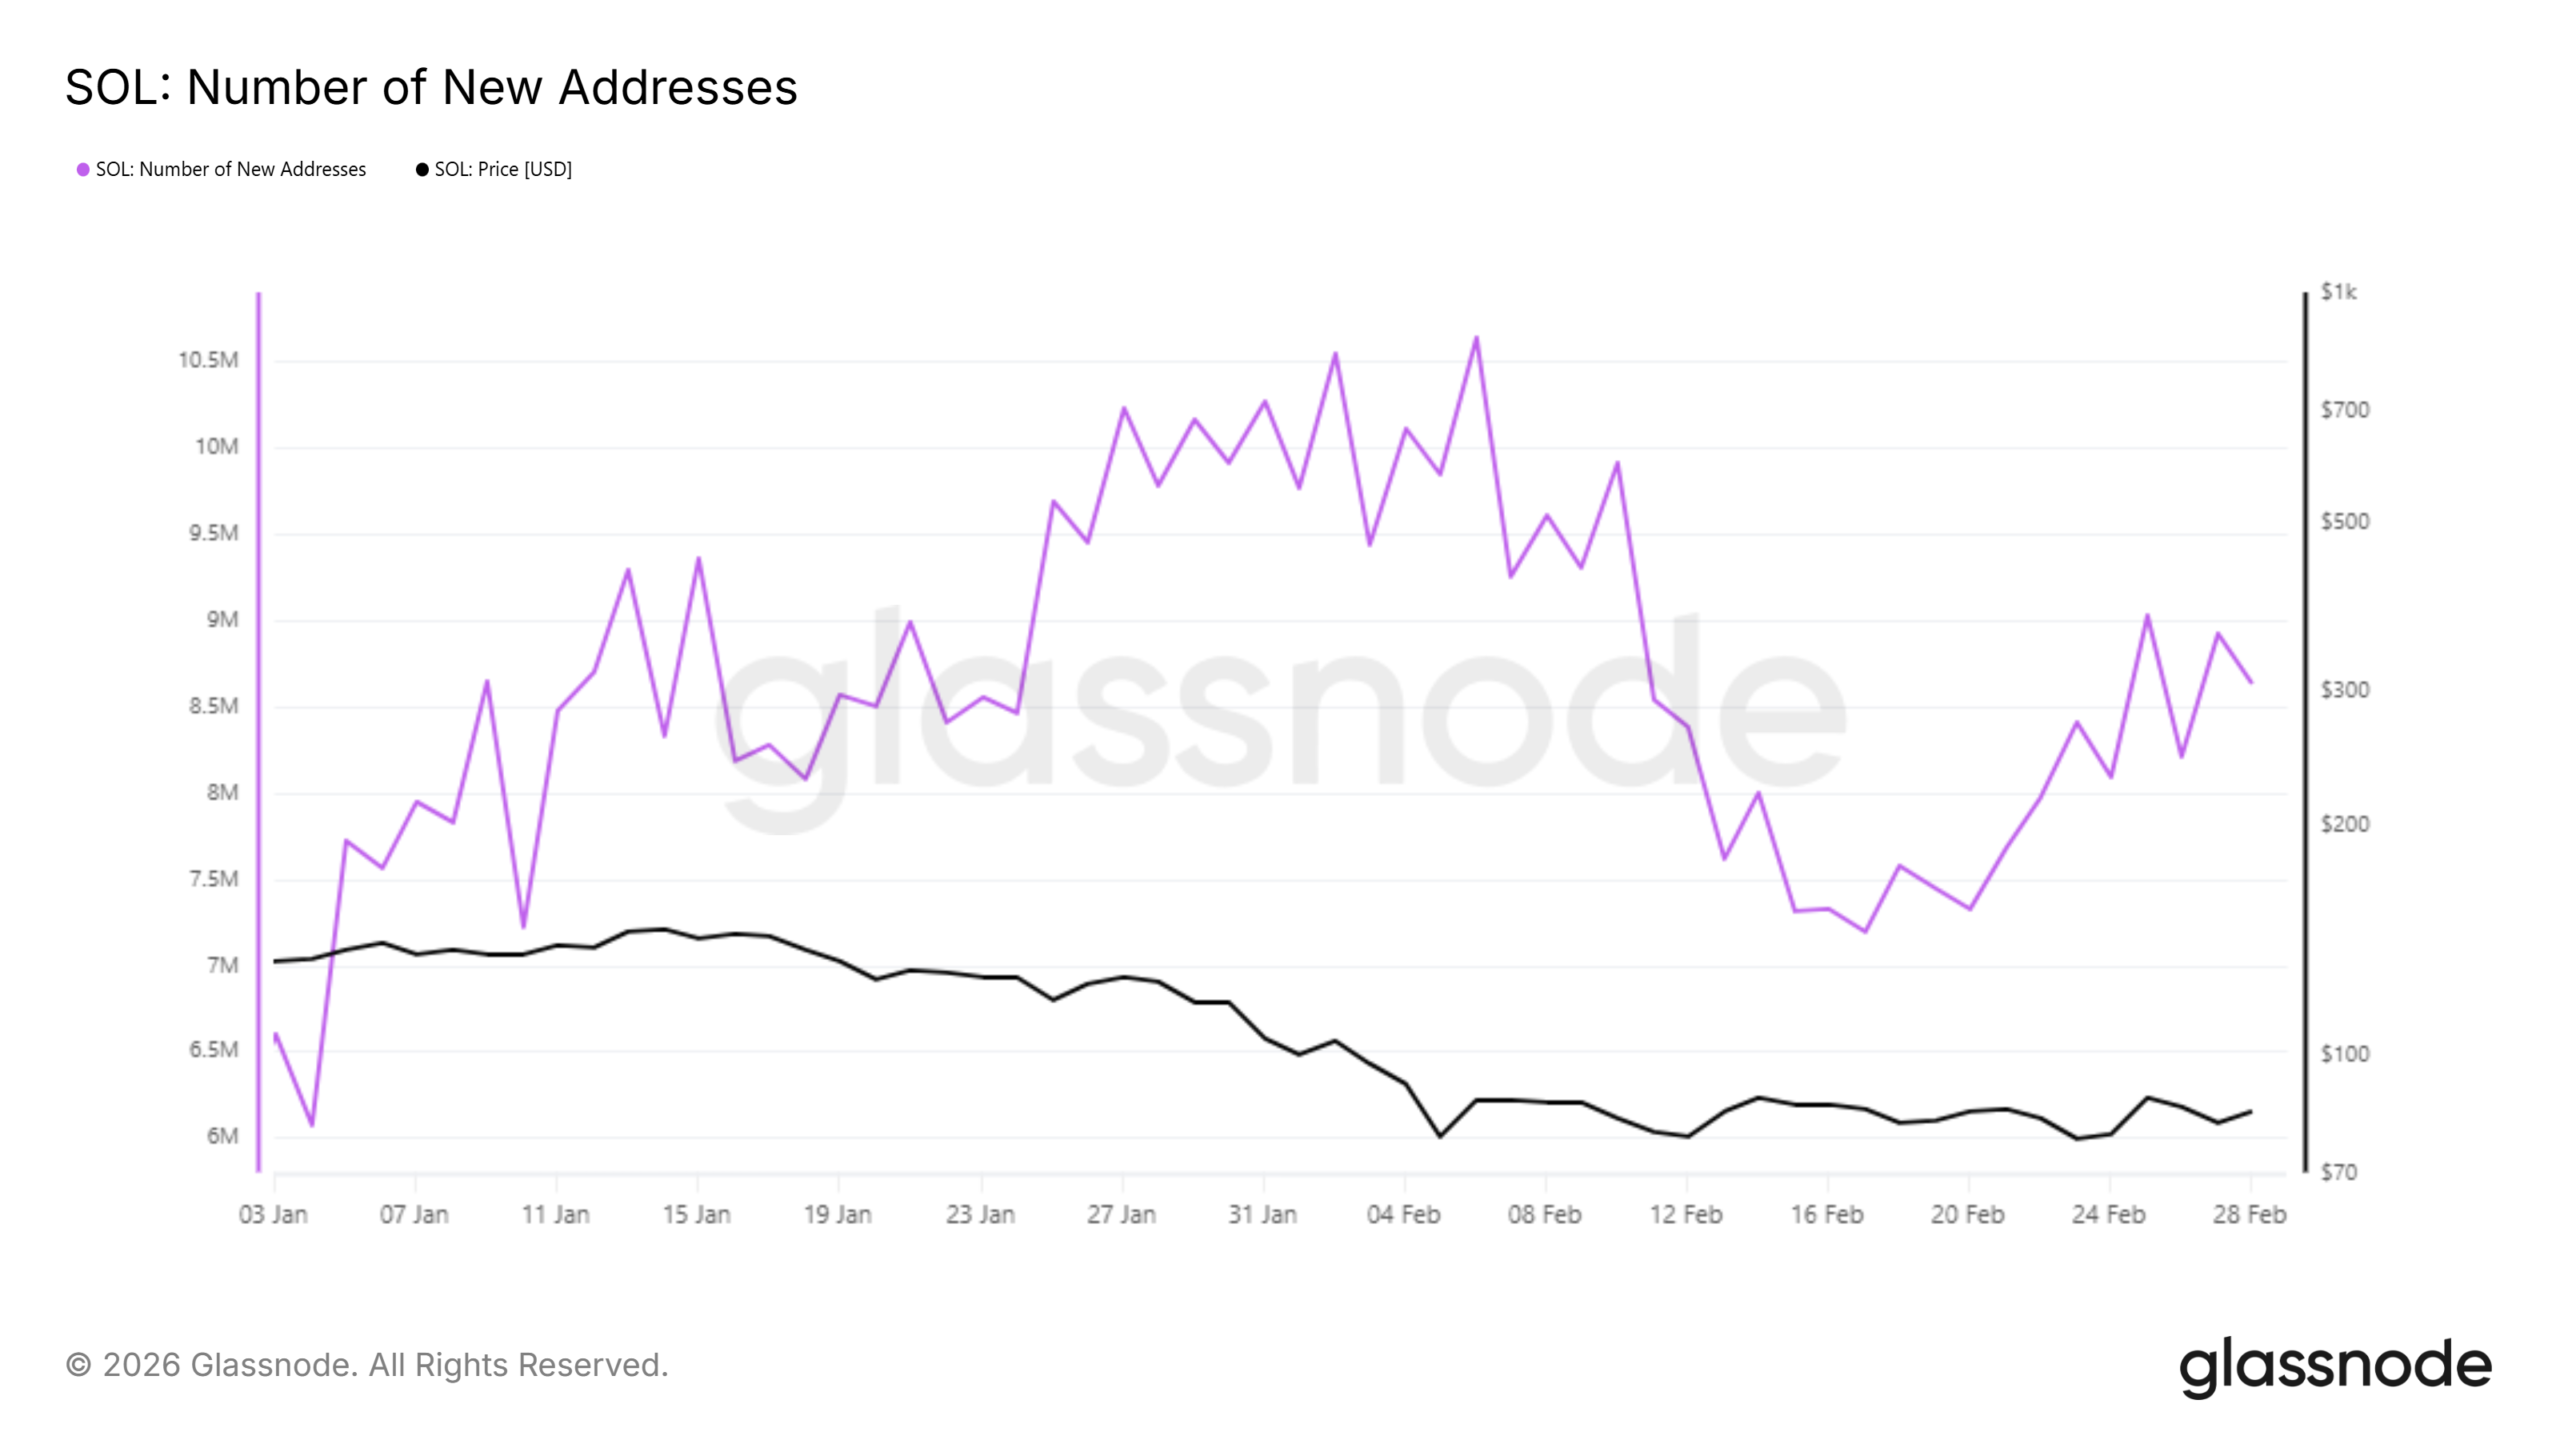
- Network activity continues expanding with daily new Solana addresses increasing by 1.4 million across a 12-day span, now totaling 8.6 million
As of March 2, 2026, Solana (SOL) continues hovering in the $84–$85 zone, maintaining a sideways pattern that has persisted for almost a full month. The cryptocurrency has repeatedly tested support near $77 and resistance around $88 without successfully breaking through either boundary.
While price action remains subdued, institutional capital continues flowing into the asset. Spot Solana exchange-traded funds in the United States accumulated $44.44 million in net weekly inflows during the previous week, with Wednesday alone accounting for $30.86 million of that total.
Year-to-date cumulative inflows into these investment vehicles have now crossed the $900 million threshold. Throughout February, these products experienced more than twelve straight days of positive net flows, a streak that occurred even while Bitcoin and Ethereum ETF counterparts witnessed capital outflows.
Retail trader behavior presents a contrasting picture. Open Interest in SOL futures contracts declined by over 6% during a 24-hour measurement period, settling at $4.89 billion. This reduction indicates position closures among derivatives traders.
Liquidations totaled $26.47 million during this timeframe, with $20.47 million stemming from long position eliminations. This concentration demonstrates widespread removal of bullish leveraged trades.

Despite these forced closures, the funding rate remains between 0.0037–0.0041%, indicating leveraged traders continue paying a premium to maintain long exposure.
Key Technical Levels
SOL continues trading beneath both its 50-day and 200-day Exponential Moving Averages, presently positioned at $99.06 and $137.23 respectively. These technical markers represent significant overhead resistance zones.
The Relative Strength Index hovers around 43, positioning below the neutral 50 threshold. MACD histogram readings display diminishing bearish pressure but have yet to generate a bullish signal crossover.
Bollinger Bands on the daily timeframe are compressing significantly. Such band contractions frequently precede substantial price movements, although the eventual direction remains uncertain until the breakout occurs.
Crypto analyst Umair identified divergent behavior between SOL’s USDT and BTC trading pairs. While the USDT pairing displays a pattern of declining highs, the BTC pair exhibits ascending highs — a divergence that has persisted for 24 days.
On-Chain Data Shows Network Growth
Blockchain analytics from Glassnode reveal daily new Solana addresses expanded by 1.4 million during the preceding 12-day period, bringing the cumulative total to 8.6 million. This metric indicates continued user adoption and network expansion.
Long-term holder positions remain profitable on aggregate, although accumulation velocity has decelerated. Data tracking hodler net position changes demonstrates sustained conviction but diminished purchasing activity.
Should SOL successfully breach $88 and subsequently $93.43, the next upside objective becomes the 50-day EMA situated near $99. A confirmed close above that level would establish a pathway toward $137.
Conversely, a breakdown below $77 would shift focus to the next support zone at $67.50, established during the February 6 low.
Trading volume for SOL decreased 5.77% to $12.20 billion, while Open Interest similarly contracted 3.73% to $4.88 billion based on the most recent data available.
Get 3 Free Stock Ebooks
Discover top-performing stocks in AI, Crypto, and Technology with expert analysis.
- Top 10 AI Stocks - Leading AI companies
- Top 10 Crypto Stocks - Blockchain leaders
- Top 10 Tech Stocks - Tech giants


