


Key Highlights
- Morgan Stanley has submitted a revised spot Solana ETF filing to the SEC, designated as MSOL, planning direct SOL ownership with potential staking capabilities.
- The digital asset is hovering around the critical $82–$84 support level following a retreat from its May peak of $98.18.
- A decisive recapture of the $87–$90 resistance band is necessary for bulls to confirm a near-term reversal pattern.
- Technical analyst CryptoCurb projects a $1,000 long-term objective based on weekly timeframe analysis, dependent on breaking through downtrend resistance.
- Market observer Ted Pillows identified significant liquidity concentration between $86–$88, with additional liquidity accumulation near the $80 threshold.
Solana finds itself at a critical technical juncture. After retreating from recent peaks, the asset has garnered renewed institutional interest following Morgan Stanley’s latest ETF submission.
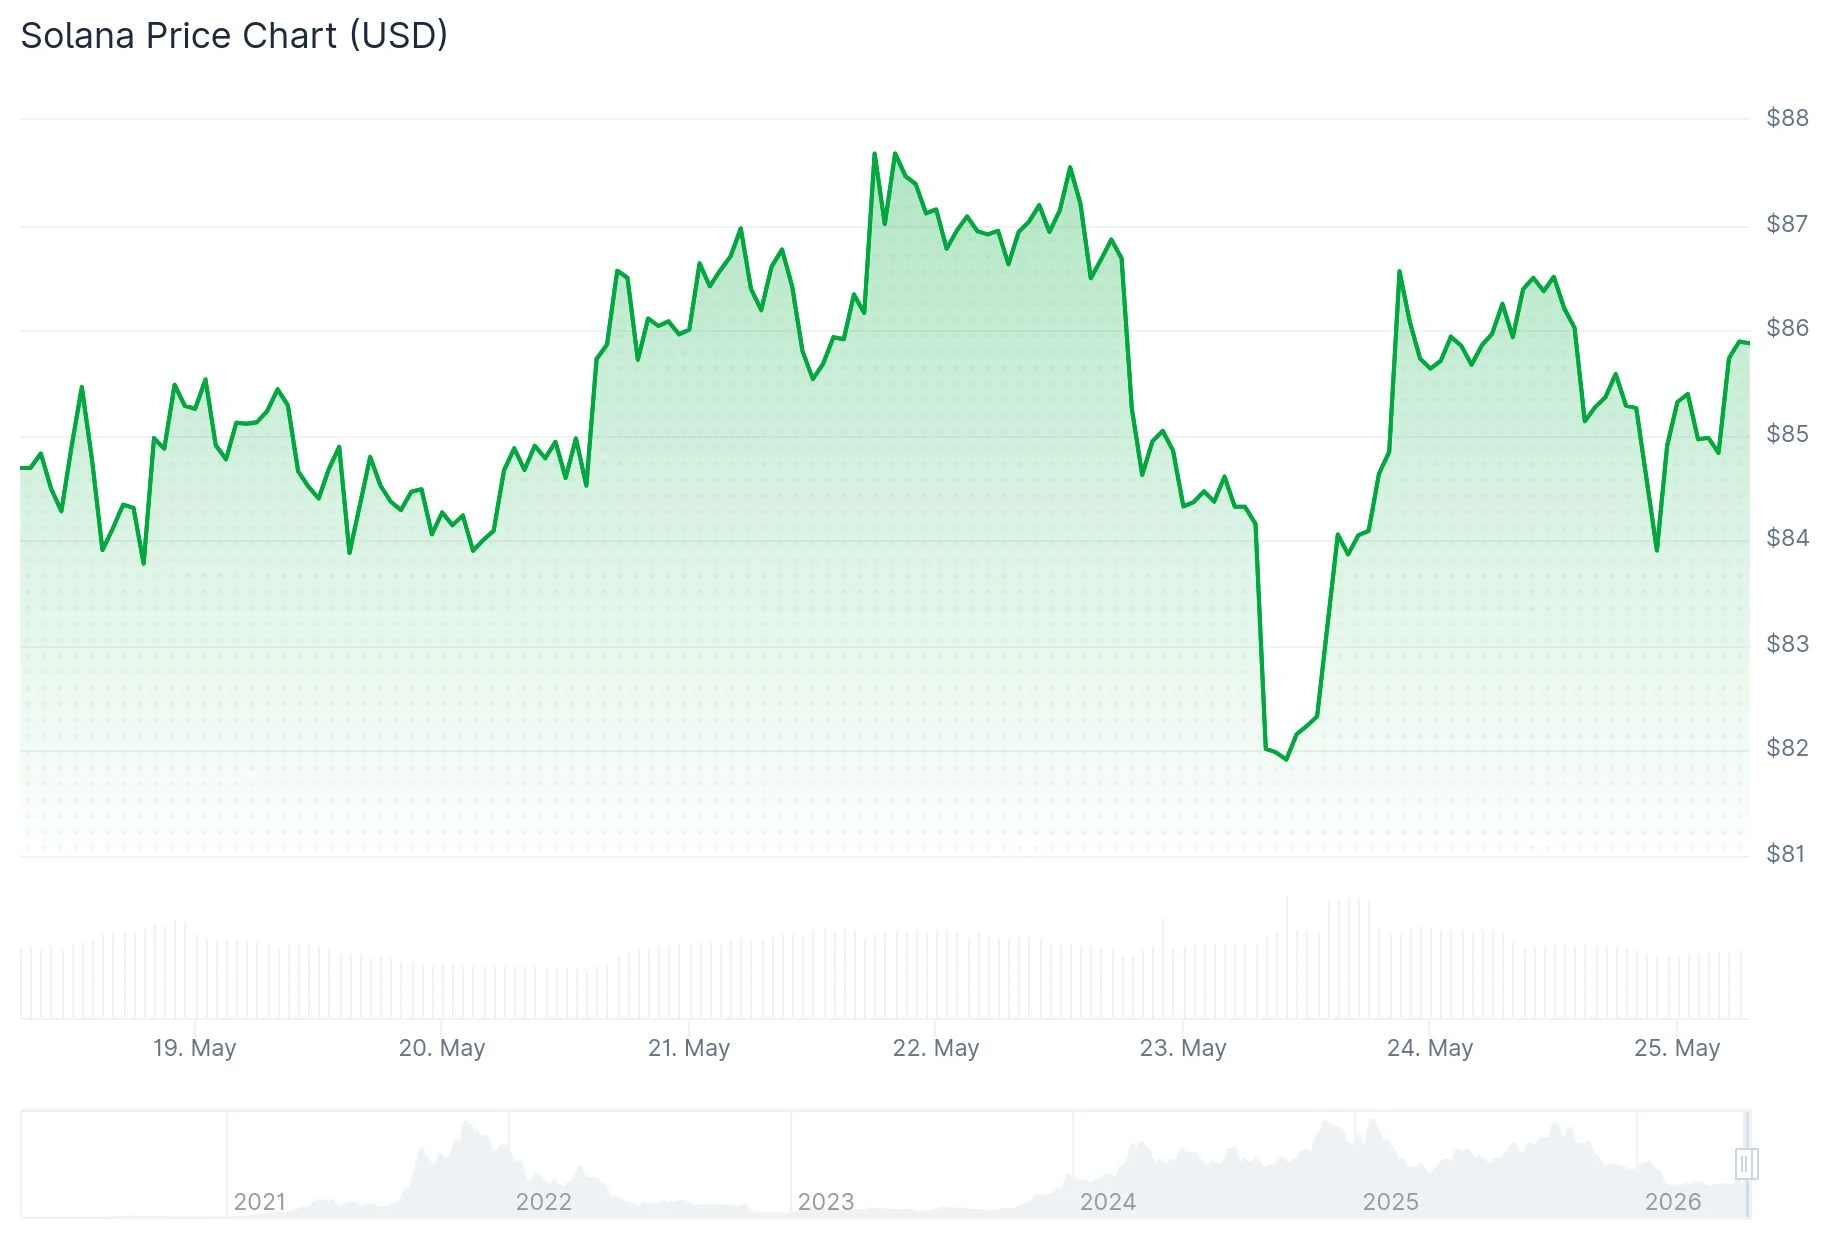
Following a breakout attempt in early May, SOL has declined from the $98.18 region. Currently, the cryptocurrency is hovering near the $82–$84 support band, a zone market participants are monitoring intensely.
The $87–$90 price region represents the crucial resistance threshold for bullish continuation. A convincing reclaim of this area would constitute the initial indication that the recent downward pressure is diminishing.
Market analyst BitGuru published a 4-hour timeframe chart illustrating the present technical situation. His analysis highlights $82–$84 as a potential inflection point should purchasing pressure materialize.
Analyst CryptoCurb presented a broader perspective using the weekly timeframe. His charting reveals SOL establishing a foundation above a significant long-term support trendline, while facing overhead resistance from a declining bearish trendline.

Long-Term $1,000 Price Projection
CryptoCurb’s technical framework identifies $1,000 as an extended upside objective. Reaching this ambitious level would necessitate a validated breach above the descending resistance structure, accompanied by sustained bullish momentum.
This projection remains unconfirmed at present. Price action must successfully maintain the foundational support and penetrate the overhead resistance barrier before this broader target becomes actionable.
Trader Ted Pillows highlighted on X that Solana exhibits concentrated liquidity in the $86–$88 price range. He simultaneously identified accumulating downside liquidity near $80, suggesting that current US-Iran diplomatic discussions could result in upside liquidity being captured before any meaningful reversal materializes.
This assessment provides valuable perspective on immediate price dynamics. The presence of liquidity at both boundaries indicates potential volatility in either direction before a definitive trend crystallizes.
Wall Street Giant Resubmits Solana ETF Application
On May 20, 2026, Morgan Stanley filed an updated S-1 registration statement for the Morgan Stanley Solana Trust. This proposed investment vehicle would be listed on NYSE Arca trading under the MSOL ticker symbol.
The structure would maintain direct exposure to Solana tokens rather than utilizing futures contracts or derivative instruments. Morgan Stanley Investment Management Inc. is designated as the Delegated Sponsor for this trust.
According to the filing documentation, the trust reserves the right to stake up to the entirety of its SOL token holdings through qualified third-party staking service providers. Such staking activities would only commence after the sponsor determines that legal and regulatory considerations present acceptable risk profiles.
Regulatory approval from the SEC remains pending before any product launch can proceed.
SOL continues trading within the $82–$84 support zone, with market participants awaiting confirmation of whether bulls can defend this level and subsequently recapture the $87–$90 resistance band to establish recovery momentum.
Get 3 Free Stock Ebooks
Discover top-performing stocks in AI, Crypto, and Technology with expert analysis.
- Top 10 AI Stocks - Leading AI companies
- Top 10 Crypto Stocks - Blockchain leaders
- Top 10 Tech Stocks - Tech giants



