
 April Price Analysis: Critical Zones Traders Must Monitor")
Quick Summary
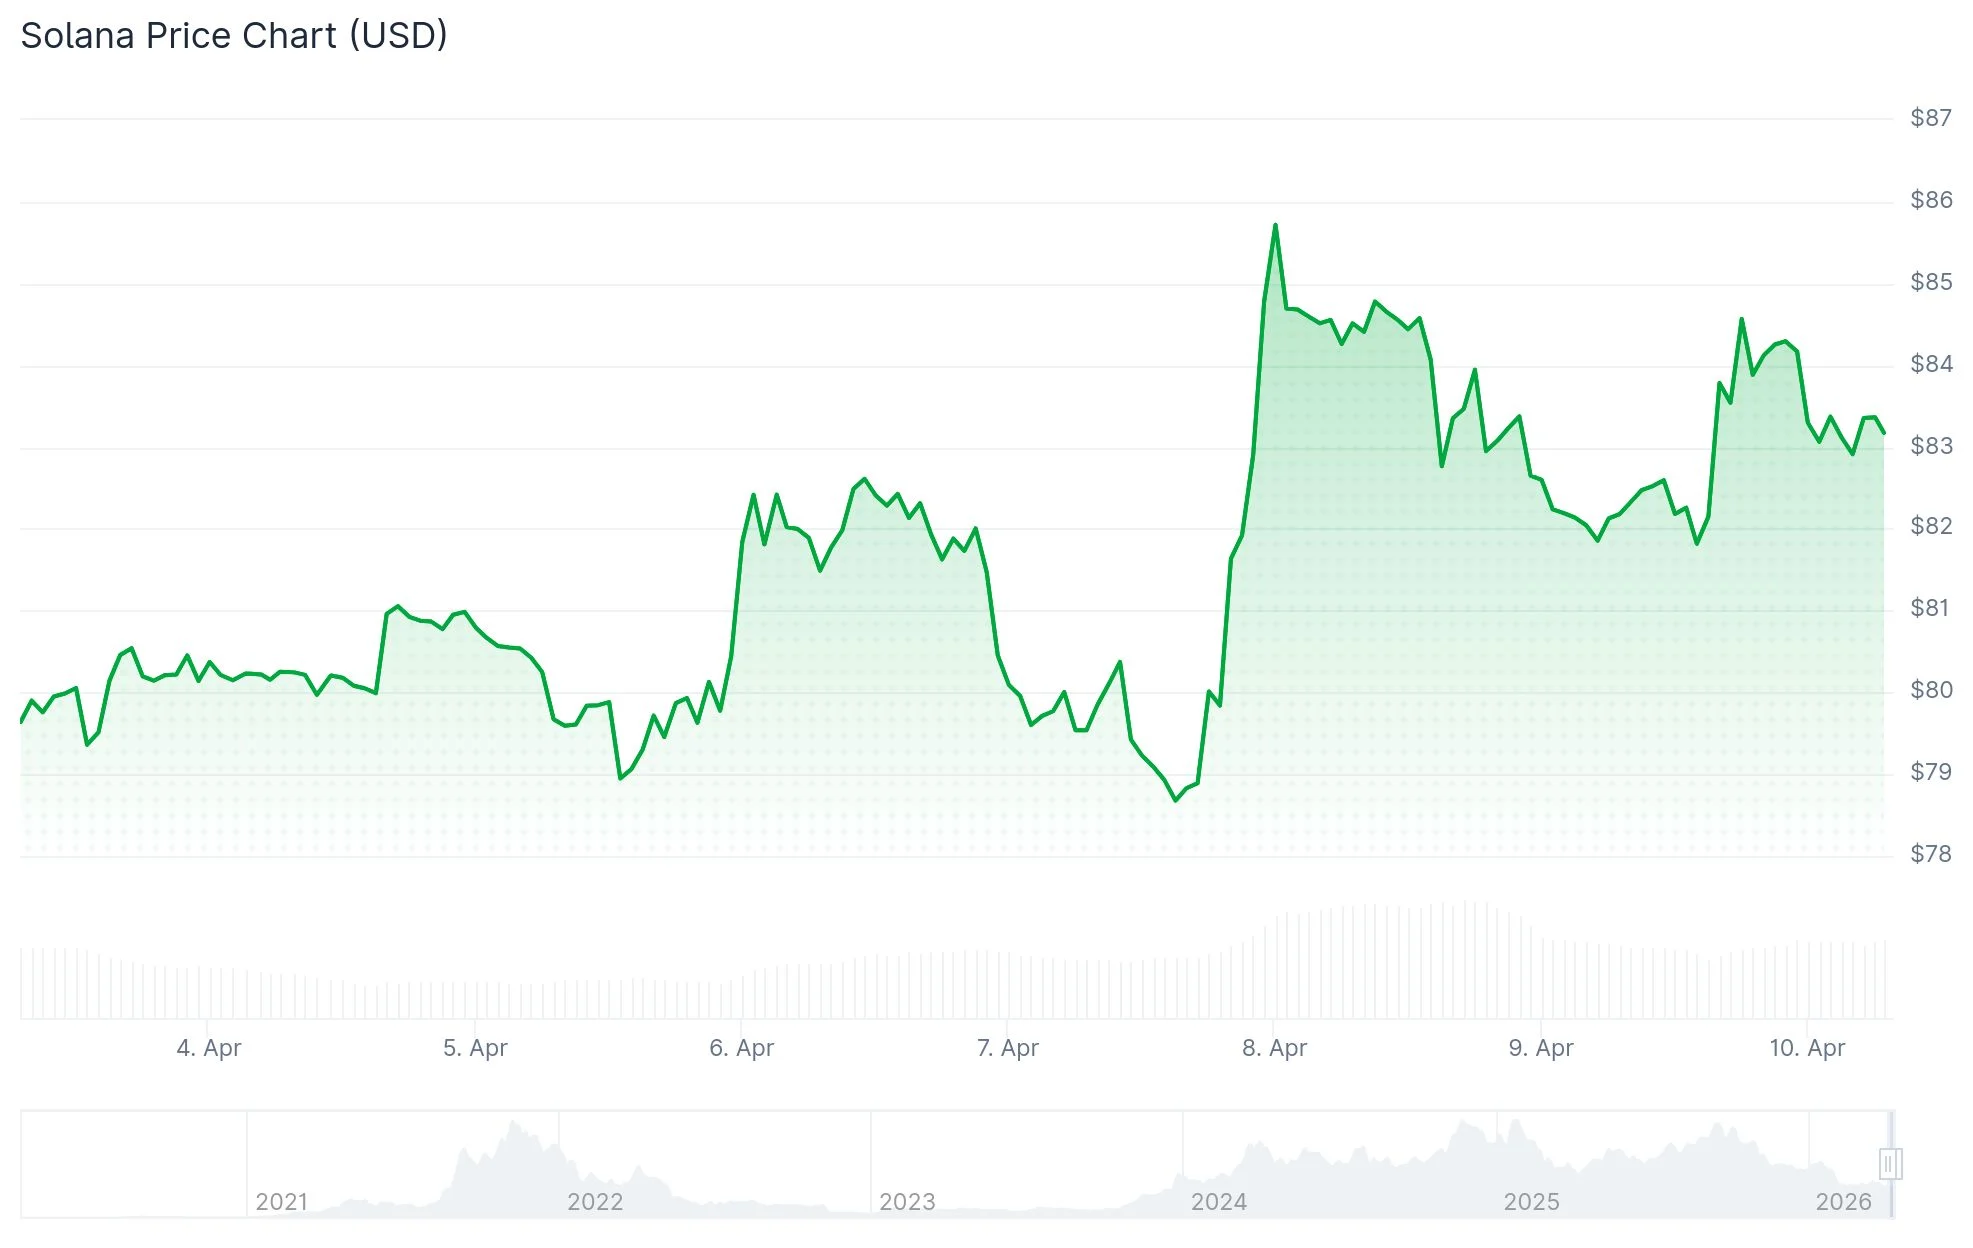
- SOL price hovers around $83, trapped beneath a descending trendline and major exponential moving averages
- Weekly ETF outflows reached $17.08 million, with Tuesday’s $15.40 million marking the largest single-day withdrawal on record
- Liquidations totaled $7.99 million in the last 24 hours, predominantly affecting short positions
- Resistance at the 50-day EMA around $87–$88 remains a critical hurdle for bulls
- Technical analyst Ali Martinez identified a recurring pattern where SOL fails to sustain gains above the 50-day MA before reversing lower
On Friday, April 10, Solana is changing hands near $83, maintaining support above the $80 threshold while facing difficulty generating upward momentum. The altcoin remains positioned beneath its 50-day, 100-day, and 200-day Exponential Moving Averages (EMAs), creating a cautious near-term technical picture.
Overhead pressure comes from a descending trendline drawn from the January 14 and April 7 peaks, which intersects near the 50-day EMA between $87 and $88. Multiple attempts to break above this confluence zone have been unsuccessful.
The Relative Strength Index (RSI) currently reads 47, indicating neutral-to-bearish momentum. Meanwhile, the Moving Average Convergence Divergence (MACD) displays a marginally bullish signal, though insufficient to confirm a meaningful trend reversal.
Institutional Capital Exits Accelerate
Investor sentiment toward Solana has deteriorated notably this week. United States-listed spot SOL exchange-traded funds have experienced cumulative outflows of $17.08 million, highlighted by Tuesday’s unprecedented single-day withdrawal of $15.40 million.

Persistent ETF redemptions generally indicate institutional reallocation away from the asset and can contribute to downward price pressure in the spot market.

In derivatives markets, CoinGlass tracking reveals $7.99 million in aggregate liquidations during the past day. Short positions accounted for $5.97 million of these forced closures, indicating bearish bets were predominantly caught offside. Open Interest declined 1.48% to $4.78 billion, signaling diminished trader engagement.
The OI-weighted funding rate holds at a marginally positive 0.0038%, while the long-to-short ratio stands at 1.0141, showing a slight tilt toward bullish positioning in current derivatives markets.
Recurring Technical Pattern Raises Concerns
Cryptocurrency analyst Ali Martinez shared observations on X regarding a repeating behavioral pattern visible since November 2025. On three separate occasions, SOL temporarily regained the 50-day Moving Average only to surrender those gains, followed by consolidation phases and subsequent sharp declines.
Martinez emphasized that extended periods trading beneath the 50-day MA have historically preceded deeper corrections, based on recent price action.
Solana has largely oscillated within a $78 to $92 corridor since early March, following a turbulent session on March 5 when prices plunged from $92 to $78 intraday.
On the bullish scenario, a decisive daily close above $88 would clear the path toward the 100-day EMA positioned near $99.86. Conversely, a breakdown below $80 would expose support zones at $76.50, with AMBCrypto’s February analysis suggesting $47.90 as a potential extended downside objective based on weekly chart structure.
Immediate resistance for SOL stands at $85, followed by $88. Critical support levels include $82.50, $81.40, and $80.
Get 3 Free Stock Ebooks
Discover top-performing stocks in AI, Crypto, and Technology with expert analysis.
- Top 10 AI Stocks - Leading AI companies
- Top 10 Crypto Stocks - Blockchain leaders
- Top 10 Tech Stocks - Tech giants


