

TLDR
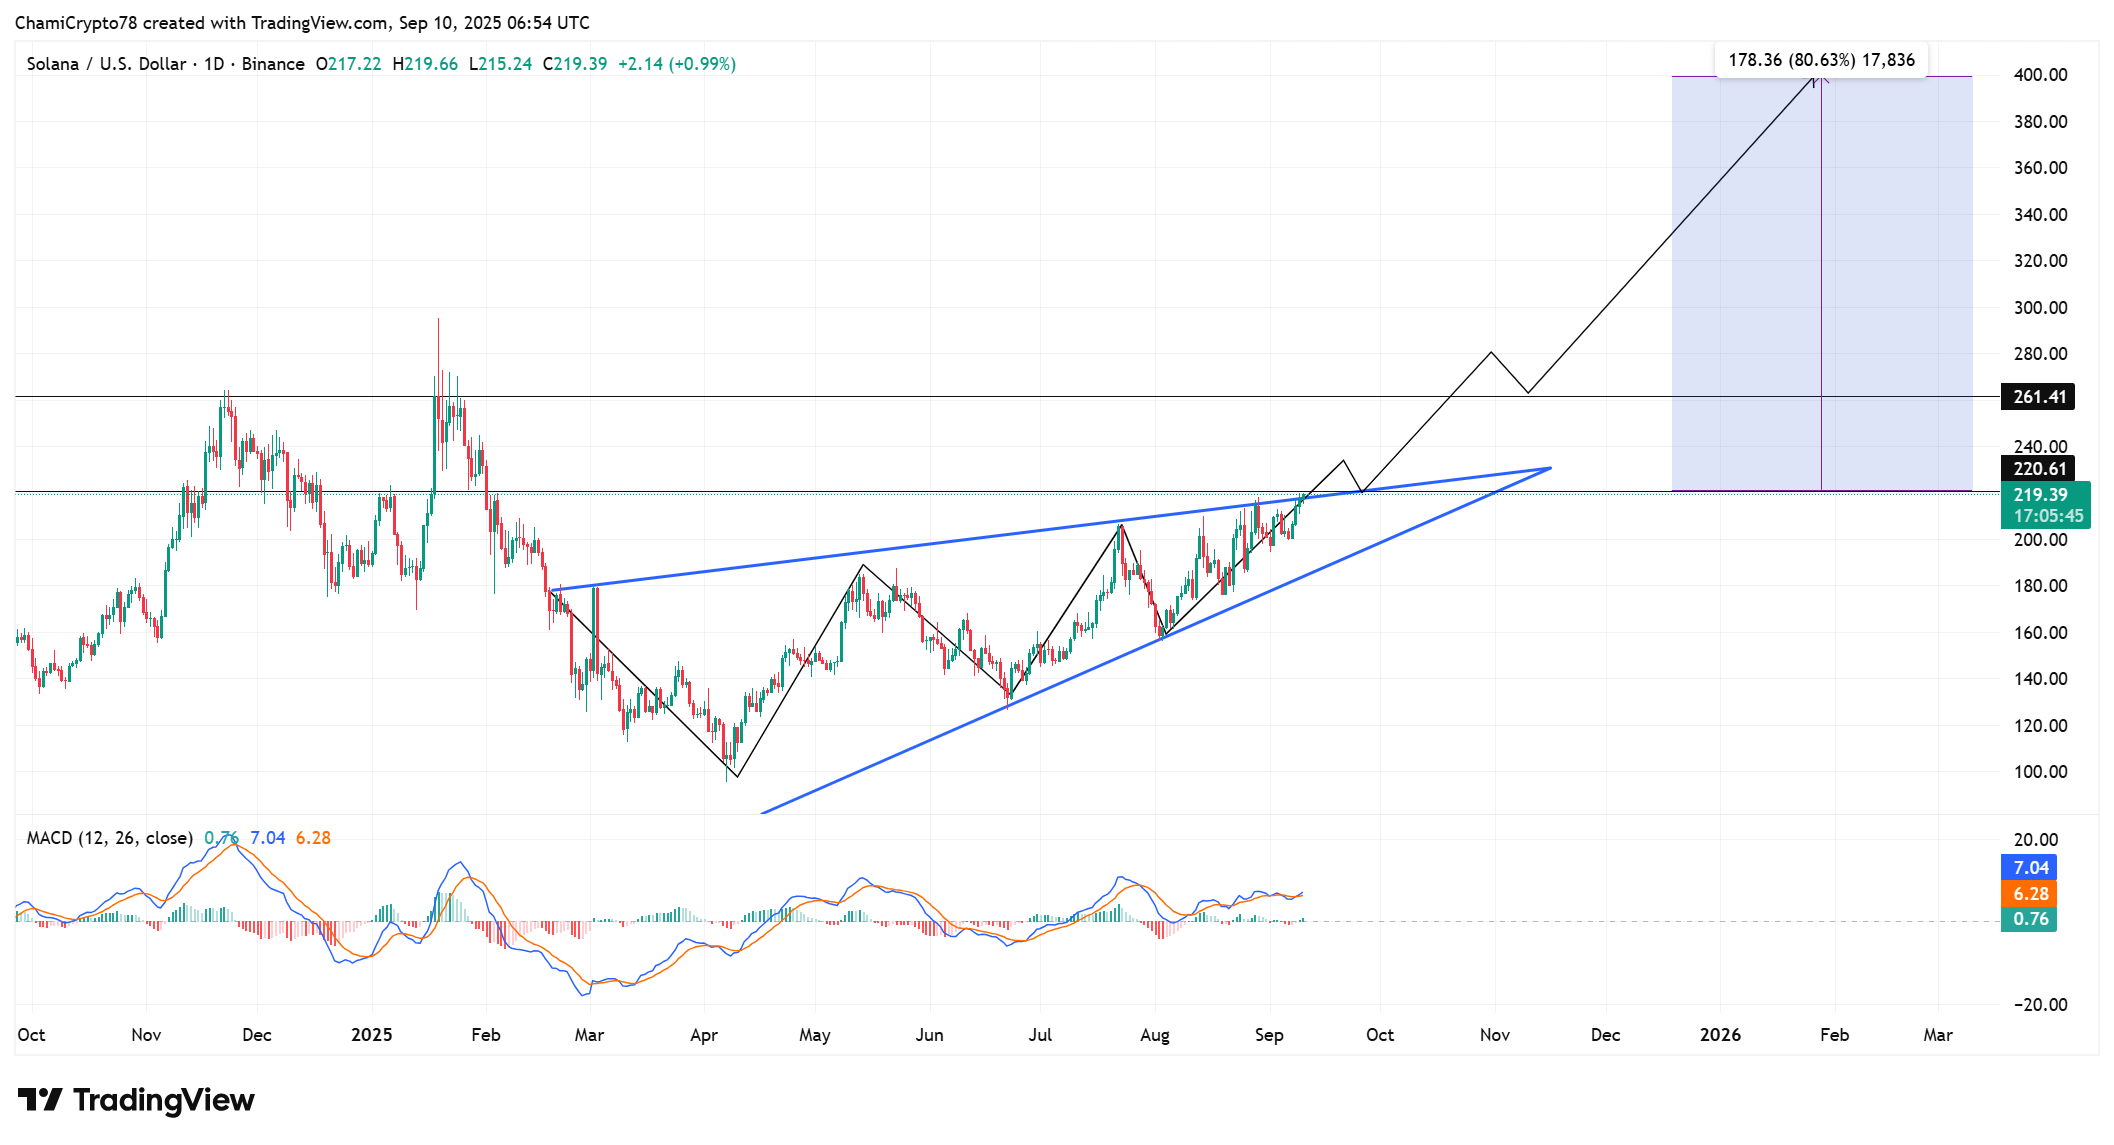
- Solana breaks out of a symmetrical triangle, signaling bullish trend toward the $400 level.
- SOL trades around $219 with key resistance at $261 and $300 ahead.
- Nasdaq lists SOL Strategies backed by $94M in holdings, boosting investor access.
- $200 support level holds firm as MACD and moving averages favor buyers.
Trading around $219, SOL’s recent move comes amid stronger institutional interest, including a Nasdaq listing tied to $94 million in Solana-backed holdings. The breakout, combined with technical signals and expanding investor support, is shaping new predictions for Solana’s next potential rally.
Technical Breakout Sets Stage for Higher Targets
Solana has moved out of a symmetrical triangle pattern, which often suggests a shift in trend direction. The breakout took place around $219, and the price has held above that level since.
The next resistance is located at $261. This level has blocked upward moves before, so it is a key point to watch. A close above this resistance could allow the price to move toward $300, where more selling may take place.
The support at $200 remains strong. This reduces immediate downside risk and helps keep market focus on the higher targets. If the $300 area is cleared, traders expect SOL to continue upward toward $400.
Technical tools like the MACD and moving averages are also showing support for continued buying pressure. Historical chart behavior during breakouts of this kind often leads to sharp upward moves, especially when resistance levels are taken out cleanly.

Nasdaq Listing and Institutional Holdings Build Confidence
The recent Nasdaq listing of SOL Strategies is drawing attention. The listing, trading under the ticker STKE, is backed by $94 million in Solana-related assets. This connects the Solana ecosystem with traditional financial markets.
It is one of the few blockchain-related strategies listed on a U.S. exchange. Market participants say this increases visibility and may attract new investment interest in Solana. A spokesperson said, “This launch reflects growing institutional demand for Solana’s underlying infrastructure.”
The listing is also expected to help increase liquidity. More access from institutional investors may lead to stronger validator participation and broader market support.
The development has been viewed as a step in bringing more capital into the Solana network. While it is early to assess the full effect, the presence of large-scale backing adds to the current positive market trend.
Price Targets Focus on $261, $300, and $400 Levels
For now, traders are closely watching the $261 level. It is the first key barrier in the path toward higher prices. If this resistance breaks, the next major zone lies at $300.
Volume levels have also risen during the breakout, supporting the current uptrend. The overall structure shows higher lows, which adds to the ongoing bullish pattern. Accumulation is increasing, pointing to growing buyer interest over time.
Analysts say if the $300 resistance is cleared, the $400 mark becomes more possible. The price action would need continued buying momentum and no sharp rejection at key zones.
Current trading patterns suggest bulls have control, though short-term pullbacks remain likely at major resistance areas. As long as $200 holds as a support level, the structure favors buyers.
With support from institutional listings and stronger volume patterns, the $400 price target is no longer seen as far off. Traders are watching each resistance level closely to confirm the next move.
Get 3 Free Stock Ebooks
Discover top-performing stocks in AI, Crypto, and Technology with expert analysis.
- Top 10 AI Stocks - Leading AI companies
- Top 10 Crypto Stocks - Blockchain leaders
- Top 10 Tech Stocks - Tech giants


