

- Solana price consolidates between key levels, awaiting a decisive breakout move.
- Analysts say upside breakout targets $300 based on Fibonacci 1.618 level.
- Downside risks include supports at $169, $125, and $95 zones.
- Solana’s DeFi TVL rises to $11.4B, signaling ecosystem strength.
Solana price action continues to tighten within a defined trading range as market analysts point to a potential breakout that could set the tone for the next major move. The asset’s recent price compression follows heightened volatility across the crypto market, with key levels now defining its near-term trajectory
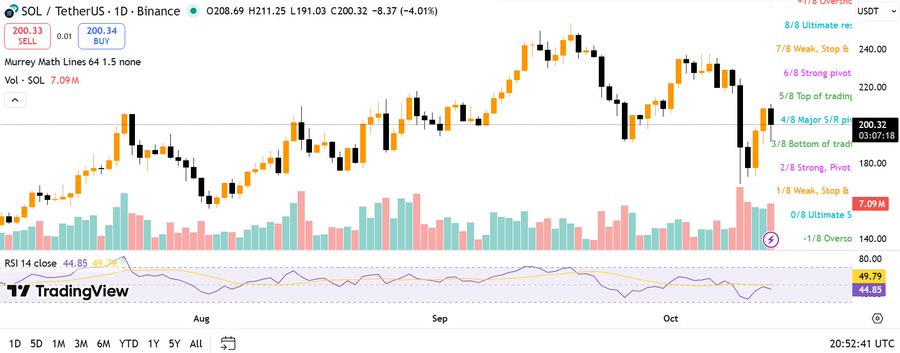
According to an analyst, “$SOL is tightening up between key levels. If it breaks upwards, the Fib 1.618 points toward $300+. According to Lark Dacis, if it breaks down, the next possible support levels are at $169, $125 and $95. One clean move from here decides the next major trend.

1-day SOL/USDT Chart | Source: Lark Davis on X
This statement highlights a technical squeeze forming on Solana’s chart after a volatile quarter that saw strong rallies and steep corrections.
Short-Term Structure Shows Climbing Channel Formation on Solana price

The Solana price is currently around $203, moving within a rising channel structure following a rebound from its recent low near $160. The pattern suggests short-term bullish momentum, though resistance between $220 and $240, marked by a previous supply zone, remains a critical barrier. A breakout above this region could trigger acceleration toward the Fibonacci extension target around $300, corresponding with historical liquidity peaks recorded in early 2024.
SOL has established higher lows after the steep decline earlier in October. The asset bounced nearly 25% from its crash low, confirming a short-term reversal structure. Momentum indicators, including the Money Flow Index (MFI) at 71.05, suggest elevated buying activity but caution that the market is nearing overbought territory.
4-hour SOL/USD Chart | Source: TradingView
Volume oscillator readings remain muted at -2.18%, signaling that while buyers are active, overall conviction is moderate. Sustained volume expansion would be required to validate a breakout toward the $240 resistance range. Conversely, fading volume alongside a rejection from this zone could lead to renewed tests of lower support levels between $169 and $125, areas that previously attracted significant bids during the mid-year correction.
On-Chain Data Supports DeFi Resilience
Supporting Solana’s technical backdrop, data from DeFiLlama shows total value locked (TVL) in Solana DeFi climbing to $11.403 billion, reflecting a 1.03% increase in the past 24 hours. This surge in TVL underscores strong on-chain participation even as market volatility persists. Stablecoin market capitalization on Solana currently stands at $16.25 billion, while daily chain fees and revenue are reported at $762,615 and $149,896, respectively.
SOL TVL Data | Source: DefiLlama
The steady rise in TVL since early 2024 indicates consistent ecosystem growth. After bottoming below $1 billion during the 2022–2023 bear cycle, Solana’s DeFi ecosystem has expanded tenfold, reaching multi-year highs. This growth has been driven by the resurgence of decentralized exchanges (DEXs) and yield protocols, with daily DEX volume surpassing $5.15 billion, a level last seen during the late-2021 bull run.
From a technical perspective, Solana price’s key resistance remains within the $220–$240 range. A decisive breakout and sustained close above this area would validate the analyst’s Fibonacci target near $300. Historically, the $300 region coincides with the upper boundary of Solana’s macro expansion trendline from early 2021, making it a psychologically significant level for traders.
Disclaimer: This is a Press Release provided by a third party who is responsible for the content. Please conduct your own research before taking any action based on the content.
Get 3 Free Stock Ebooks
Discover top-performing stocks in AI, Crypto, and Technology with expert analysis.
- Top 10 AI Stocks - Leading AI companies
- Top 10 Crypto Stocks - Blockchain leaders
- Top 10 Tech Stocks - Tech giants


