

TLDR
- Solana broke below its ascending trendline after repeated $220 rejections.
- Price hovers below $100, with the next supports near the $85 and $64 zones.
- The monthly chart forms an ascending triangle with resistance near $240.
- Volume declines despite steady accumulation, signalling trader caution.
Solana’s price action is entering a critical phase as technical charts show tightening compression between long-term support and resistance levels. Despite short-term weakness, the broader structure suggests potential for a significant breakout. Traders and analysts are watching closely as the cryptocurrency tests the limits of its multi-month consolidation zone, hovering near the $200 mark—a region that could define its next major trend.
Solana Faces a Structural Breakdown on the Daily Chart
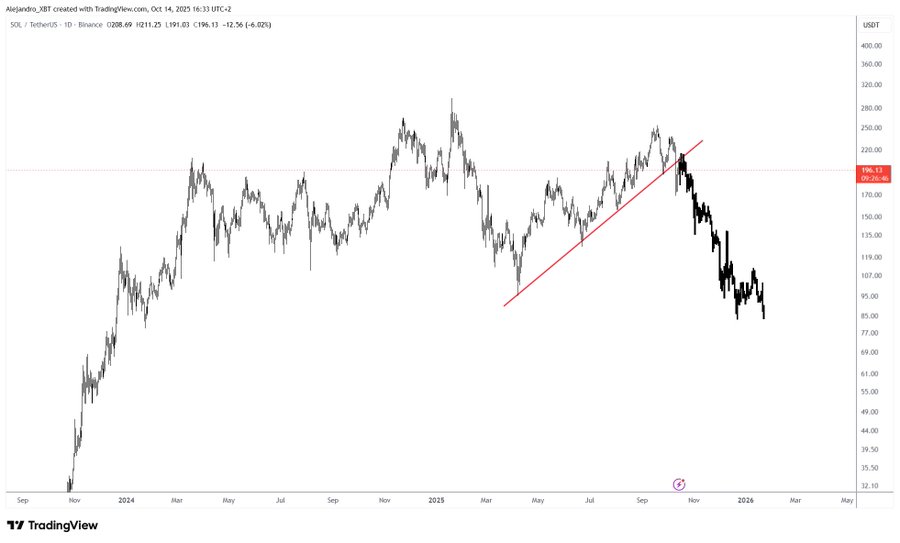
The Solana (SOL/USDT) daily chart shows clear weakness after breaking below its ascending trendline, which previously acted as strong support during mid-2025. This breakdown marked a change in market sentiment, transitioning from a bullish continuation to a corrective phase.
Following multiple rejections around the $210 to $220 zone, SOL lost upward momentum and dropped sharply toward $100, a price area that has historically drawn high liquidity and buying interest. Currently, the token trades below $100, with sellers maintaining control as the price consolidates within a descending channel.
SEI/USD 4H Chart | Source: X
Relief rallies remain capped by lower highs, showing continued selling pressure. Sustained closes below $100 could expose the next major support targets at $78 and $64, levels that align with key Fibonacci retracements from the last major uptrend.
Momentum Indicators Confirm Bearish Control
Furthermore, momentum signals such as RSI and MACD reinforce the prevailing downtrend, staying below their neutral midlines and showing no immediate bullish divergence. This suggests that sellers continue to dominate, with buyers yet to demonstrate meaningful strength. The absence of a clear reversal pattern implies that Solana may continue its correction phase in the near term.

However, a daily close above $130 could shift sentiment by reclaiming the broken trendline and signaling early stabilization. Historically, such recoveries have marked the start of accumulation before broader trend reversals. For now, traders are watching closely for evidence of sustained buying volume to support this potential recovery scenario.
The Monthly Chart Points to an Ascending Triangle
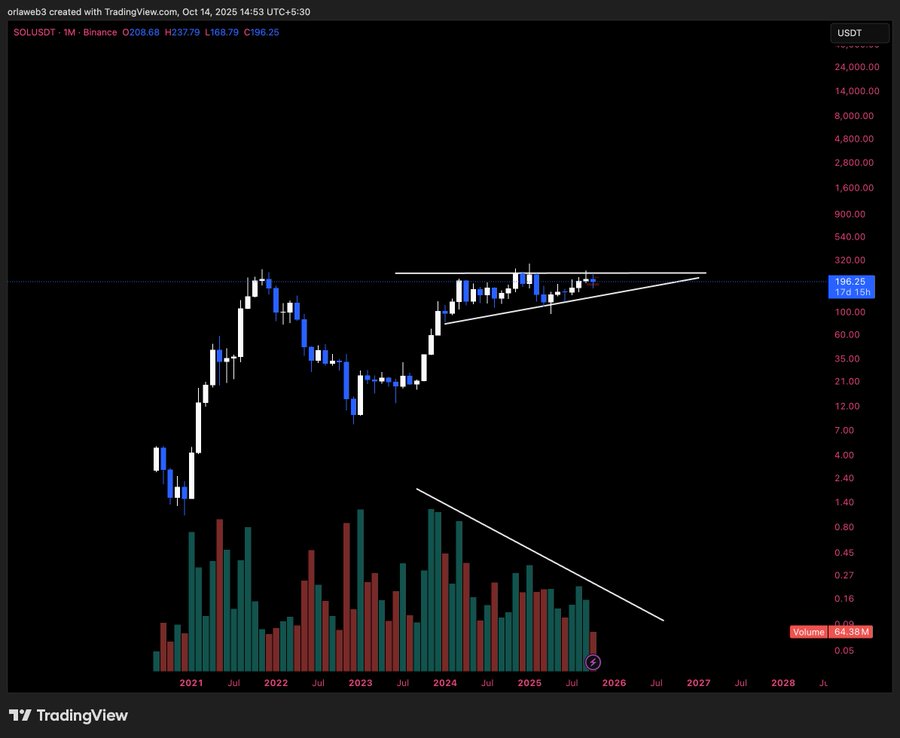
In addition, zooming out to the monthly timeframe, Solana presents a different narrative. The chart reveals an ascending triangle formation, suggesting an ongoing consolidation phase that could precede a major breakout. The upper resistance at $220 to $240 remains the key level to watch, while a series of higher lows shows that buyers continue to defend the structure
SEI/USD 4H Chart | Source: X
Yet, the declining volume trend adds a layer of caution. It reflects reduced participation, likely as investors await confirmation of a breakout before entering new positions. A surge in volume accompanying a move above $240 would confirm renewed institutional interest and potentially ignite the next major rally phase.
Long-Term Support Remains Intact
Even so, from a broader perspective, Solana’s resilience above $150 to $160 shows persistent investor confidence despite market volatility. This range has acted as a key support base since early 2024, cushioning multiple pullbacks. Maintaining this area is vital for preserving Solana’s long-term bullish structure.
Still, a close below this range could invalidate the ascending triangle and open room for a deeper correction toward $110 to $120. Yet, given Solana’s consistent ecosystem growth and increasing institutional adoption, many analysts view the current consolidation as a healthy reset within a larger bullish cycle. The next decisive move will likely come from a breakout above $240, supported by stronger trading volume and improved liquidity conditions across the market.
Get 3 Free Stock Ebooks
Discover top-performing stocks in AI, Crypto, and Technology with expert analysis.
- Top 10 AI Stocks - Leading AI companies
- Top 10 Crypto Stocks - Blockchain leaders
- Top 10 Tech Stocks - Tech giants


