

TLDR
- Shiba Inu rose to $0.0000074 on Dec. 29 after forming a golden cross on the hourly chart.
- SHIB is still down 66.8% for 2025 despite short-term rebound and recovery signs.
- Resistance levels stand at $0.00000826 and $0.000011, while support holds at $0.000007.
- SHIB remains inside a descending channel despite price stabilizing above the VWAP.
As 2025 draws to a close, Shiba Inu has flashed a rare bullish signal—a golden cross on its hourly chart—capturing traders’ attention amid a broader crypto market still struggling for direction. This technical pattern, where the 50-period moving average crosses above the 200-period moving average, suggests short-term momentum may be shifting. With SHIB trading near $0.0000074, market participants are watching closely to see if this rebound can gain traction.
Shiba Inu registers short-term golden cross as price attempts rebound
Shiba Inu formed a golden cross pattern on its hourly chart within the final 72 hours of 2025. The golden cross occurred as the hourly 50-period moving average crossed above the 200-period moving average. This pattern often reflects strengthening price momentum.
Following the pattern, SHIB rose from a low of $0.000007 on December 26 to reach $0.00000739. It then moved slightly higher on December 29 to touch $0.0000074. At the time of publication, SHIB was trading at $0.000007382 with a 24-hour gain of 2.82%.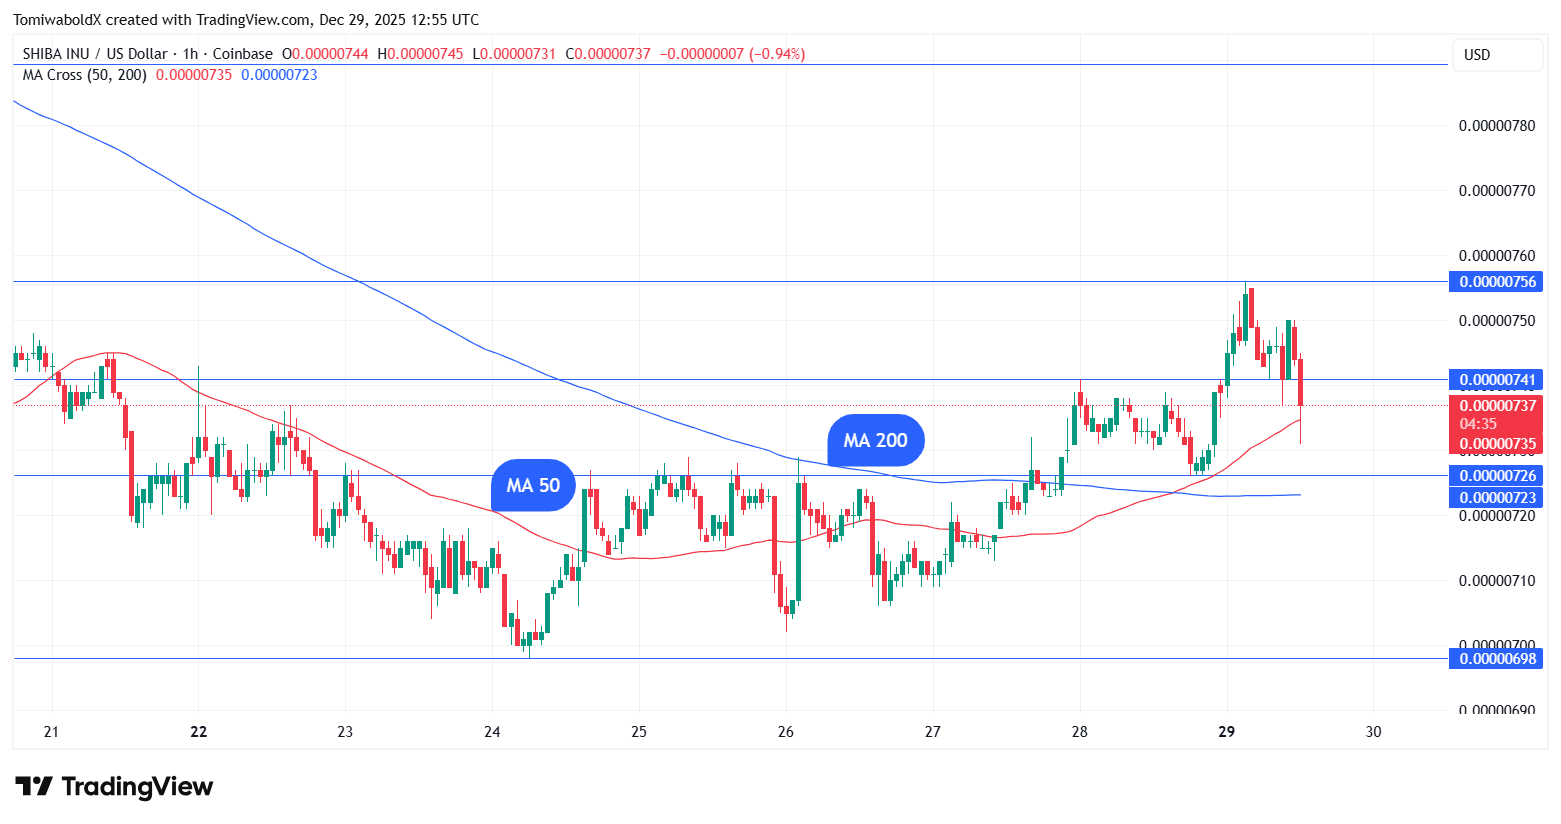
While this movement shows some improvement, analysts note that the broader trend has yet to shift. SHIB’s performance for December remains negative, and the token is still down over 66% in 2025, based on CoinGecko data.
Short-term momentum builds but broader trend remains under pressure
The recent golden cross appeared as SHIB attempted a late-year rebound. However, the overall structure on higher timeframes remains bearish. On the daily chart, SHIB continues to trade within a descending channel that has persisted since October.

SHIB has been unable to break above its Supertrend resistance level near $0.00000825. The price continues to make lower highs, indicating that each rally has been sold into. The latest bounce began at $0.0000067, which has acted as support near the lower boundary of the descending channel.
GM Everyone! ☕️$SHIB still looks heavy, but it’s getting close to a level where reactions matter.
Price is grinding lower inside the descending channel and pressing into the 0.0000065–0.0000067 demand area, with momentum diverging.
I’m watching how it behaves there. A… pic.twitter.com/eSdEbUPQIH
— Surya (@suryapro) December 29, 2025
This level also aligns with Parabolic SAR support and has helped SHIB avoid further downside. However, the current rebound lacks strong volume, and the structure is still corrective. Until SHIB breaks above the upper trendline, rallies may remain short-lived.
Narrow range and declining volume reflect wait-and-see market behavior
Shiba Inu’s price has settled into a narrow trading range between $0.00000698 and $0.00000729 over recent days. This range-bound action has come with reduced volume and thinner liquidity, showing a lack of strong conviction from either buyers or sellers.
On intraday charts, SHIB is holding just above the volume-weighted average price (VWAP), which has helped stabilize short-term action. The 30-minute RSI has moved back toward the mid-50s after nearing overbought conditions. While short-term balance is visible, momentum remains weak overall.
Traders appear cautious as the year ends, with the broader crypto market also lacking direction. Many altcoins, including SHIB, are reacting to macroeconomic conditions and low liquidity during the holiday period.
Key levels and 2026 outlook in focus as SHIB ends the year below trendline
Traders are now watching to see whether SHIB’s rebound can extend beyond its resistance levels. The next major resistance stands at $0.00000826, followed by $0.000011. A move above the descending trendline could confirm the end of the short-term bearish pattern.
Support continues to hold around the $0.000007 range, with $0.00000699 acting as a local floor. Futures market data shows that leverage positions have decreased and exchange withdrawals have increased, which may help stabilize the market.
Get 3 Free Stock Ebooks
Discover top-performing stocks in AI, Crypto, and Technology with expert analysis.
- Top 10 AI Stocks - Leading AI companies
- Top 10 Crypto Stocks - Blockchain leaders
- Top 10 Tech Stocks - Tech giants


