
 Price: The Memecoin That Refuses to Back Down as Markets Wobble")
TLDR
- SHIB maintains $0.000015 support level despite sector-wide selloff triggered by $300M Trump Coin investment
- Potential returns of 80% possible if price reaches March 2025 high of $0.000027
- On-chain metrics show minimal panic selling from long-term holders
- Technical indicators like Klinger Oscillator and Parabolic SAR signal bullish continuation pattern
- Market conditions, including easing trade tensions and cooling inflation, could support further price growth
The memecoin market experienced turbulence this week as Shiba Inu (SHIB) showed remarkable resilience by maintaining support above the $0.000015 level. This stability comes despite sector-wide fear triggered by a major $300 million capital injection into Trump Coin by a Chinese tech firm reportedly connected to TikTok stakeholders.
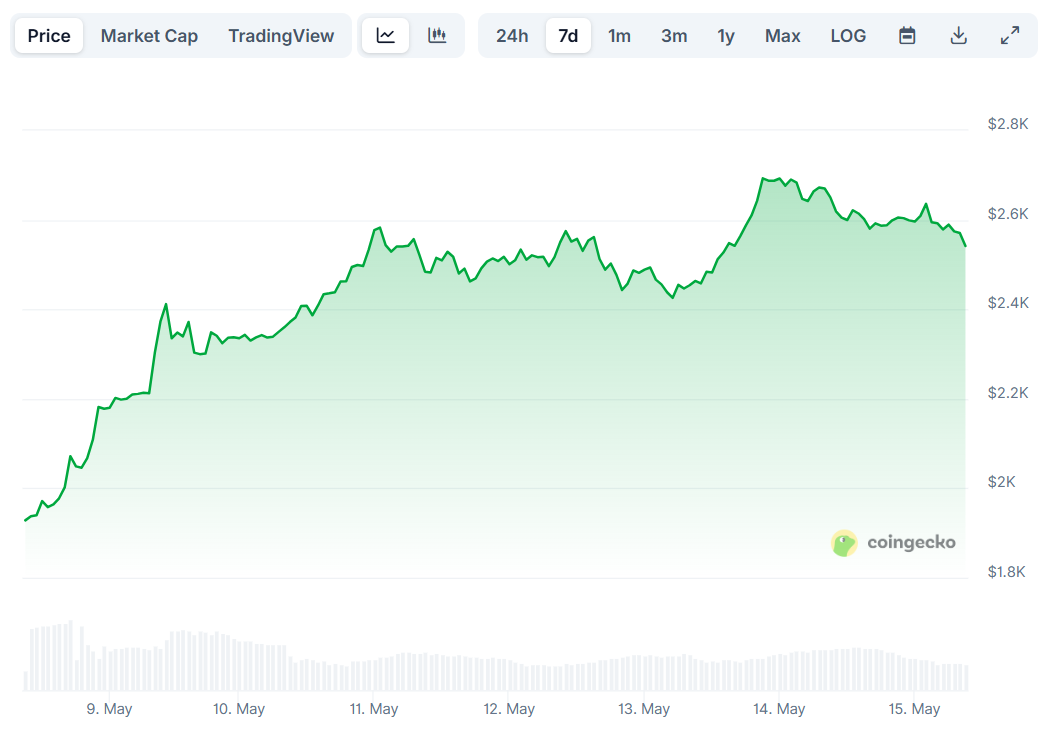
SHIB closed at $0.00001494 on Wednesday, down 3.6% for the day but still maintaining its 7-day gains of 25%. This performance contrasts sharply with nine of the top ten memecoins which posted losses, including Dogecoin (DOGE) down 2.4% and BONK down 3.5%.
The overall memecoin sector saw its market capitalization fall to $78.6 billion, representing a 0.7% decrease over 24 hours. Pudgy Penguins was the only top-10 meme asset to close in positive territory, gaining 8%.
Traders appear to be reallocating funds toward mid-cap memecoins not connected to U.S. political figures. This shift in investor sentiment has benefited SHIB, which many now view as one of the more stable options in the volatile memecoin space.
Investment Potential at Current Levels
At the current price of approximately $0.000015, investors are considering the potential returns SHIB might generate. Historical data offers some perspective.

A $1,000 investment at current prices would yield about 66.6 million SHIB tokens. Should the price return to its recent March 2025 high of $0.000027, this investment would grow to $1,800 – an 80% return.
Similarly, $5,000 invested now would purchase 333.3 million SHIB tokens with potential to increase to $9,000 at the March high. A $10,000 investment could grow to $18,000 under the same scenario.
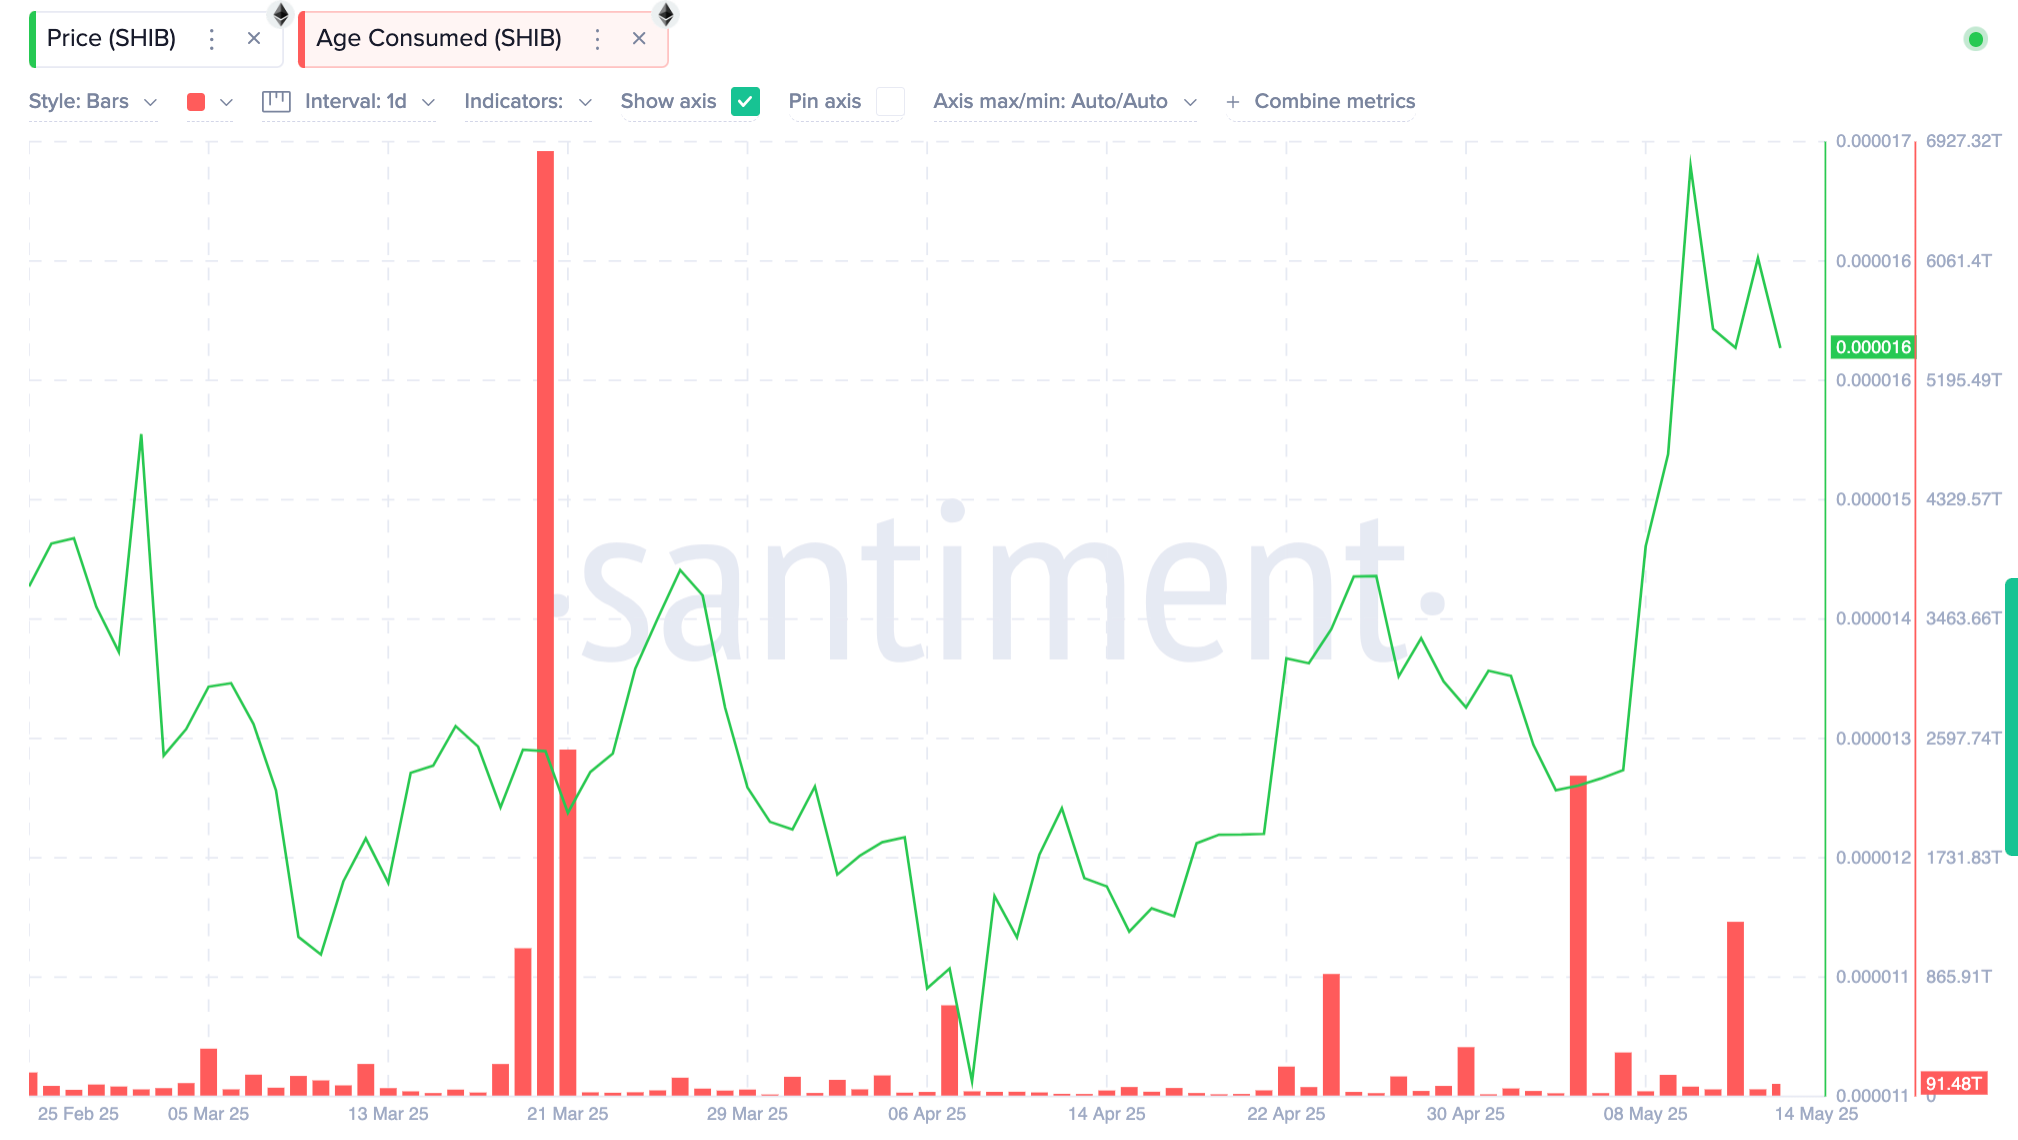
On-chain indicators support this bullish outlook. Santiment’s Age Consumed metric for SHIB remained flat at 91.4 trillion even after the recent price correction, suggesting long-term holders are not panic selling.
SHIB’s current market behavior indicates a consolidation range rather than a breakdown pattern. If it maintains the $0.000015 floor and regains upside volume, it could break out toward targets of $0.000018 and then $0.000022.
Technical Analysis Points to Upcoming Movement
Technical indicators are aligning to suggest a potential upward move for SHIB. The price is compressing above dynamic support from the Donchian Channel midline at $0.00001498, with candlesticks forming higher lows despite contracting volume.
The Klinger Oscillator shows a narrowing divergence between its fast and signal lines, indicating weakening bearish momentum. The Parabolic SAR dots remain below the current price structure at $0.00001435, which is traditionally interpreted as a bullish signal.
This low-volume pullback may reflect distribution exhaustion rather than renewed selling pressure. If buyers can push SHIB above $0.00001600 with expanding volume, the next resistance level will be $0.00001765.
Should support at $0.00001498 fail, the next support level would be at the Parabolic SAR’s $0.00001435, with a deeper retracement toward $0.00001230 possible if that level doesn’t hold.
The broader market environment also appears favorable for SHIB and other risk assets. Recent developments include easing trade war tensions between the US and China, with both countries announcing reduced tariffs this week.
Good news for global trade:
US and China are lowering tariffs for the next 90 days. The US is cutting their tariffs on China from 145% to 30%, and China is reducing their tariffs on US goods from 125% to 10%.
This gives both sides some breathing room, but the real question is… pic.twitter.com/szisihmqVN
— Alek (@Alek_Carter) May 12, 2025
US inflation data released Tuesday hit a four-year low, suggesting that concerns about tariff-related inflation spikes have been overstated. Economic indicators suggest that while showing some weakness, the US economy isn’t facing an imminent major recession.
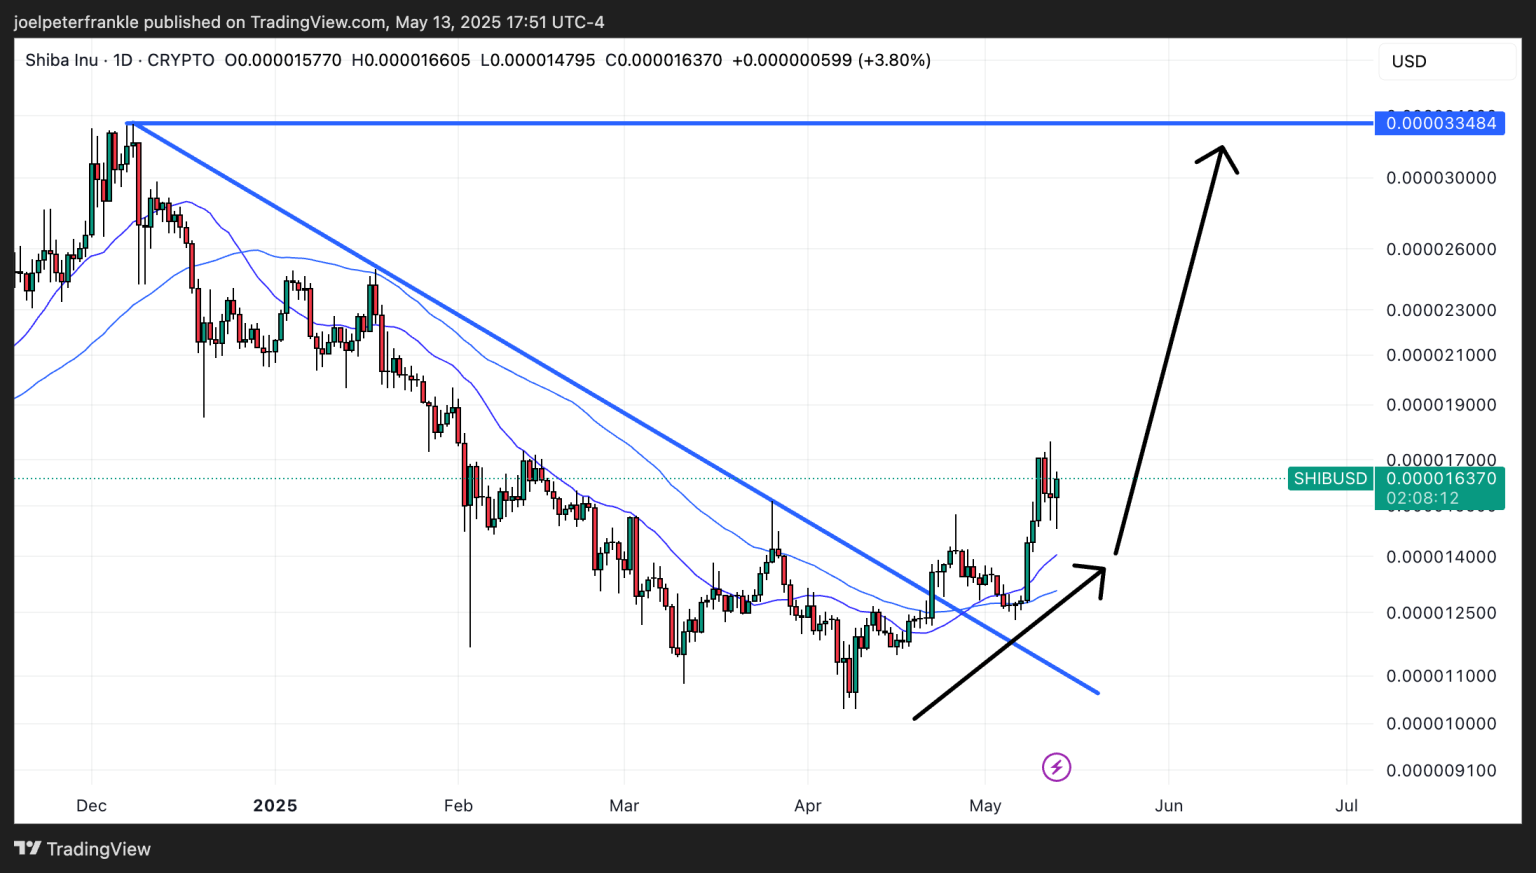
These macro factors create a positive backdrop for risk assets like SHIB to continue their upward trajectory in the coming weeks. Chart analysis strengthens this bullish case, as SHIB broke above a long-term downtrend in mid-April and recently bounced strongly from its 21 and 50-day moving averages.
The current price action suggests potential for a climb toward late 2024’s highs near $0.000033, which would represent a doubling from current levels.
SHIB is trading at $0.00001562 as of Thursday, continuing to hold above critical support levels as traders position themselves for a possible breakout to the upside.
Get 3 Free Stock Ebooks
Discover top-performing stocks in AI, Crypto, and Technology with expert analysis.
- Top 10 AI Stocks - Leading AI companies
- Top 10 Crypto Stocks - Blockchain leaders
- Top 10 Tech Stocks - Tech giants


