

Pi Network now faces its most consequential period since Open Network activation. Ecosystem milestones continue stacking, yet market behavior reflects hesitation rather than enthusiasm. Price compression, unlock circulation, and technical resistance combine into a decisive technical zone. Recent movement shows PI fluctuating between approximately $0.13 and $0.15, with repeated rejection near its 50-day EMA resistance. That technical barrier has prevented sustained recovery attempts despite ecosystem announcements. When development acceleration fails to immediately translate into price expansion, analysts begin examining structural alignment between supply mechanics and participation demand. This phase does not resemble collapse, yet it does not resemble breakout. It resembles compression before structural resolution.
Open Network Anniversary and Ecosystem Signaling
The Open Network anniversary update served as a symbolic and operational checkpoint simultaneously. Leadership emphasized ecosystem expansion rather than short-term valuation focus, reinforcing phased deployment logic. Badge architecture launched as a contribution recognition framework, differentiating participants by engagement tiers.
Recognition systems historically improve retention metrics within decentralized communities because visible status markers reinforce behavioral consistency. However, recognition layers do not directly counterbalance circulating supply pressure. Circulating dynamics remain central to valuation stability. Anniversary messaging projected long-term orientation, yet short-term price response remained muted. That divergence highlights tension between infrastructure maturity and immediate market expectations.
Founder Q&A: Transparency During Compression
Founders recently addressed community concerns publicly, covering unlock schedules, exchange trajectory, roadmap sequencing, and ecosystem development. Transparency improved informational clarity while also magnifying scrutiny.
Community reaction appeared mixed, with segments expressing impatience regarding price stagnation near $0.14 levels. Leadership reiterated controlled pacing strategy rather than rapid acceleration into full liquidity exposure. Strategic pacing often enhances durability but rarely satisfies participants focused on immediate price expansion. Historical precedent across digital assets shows that transitional infrastructure phases often precede delayed valuation recognition.
Transparency reduces uncertainty but does not eliminate supply absorption requirements. Price stabilization demands measurable equilibrium between new circulation and organic demand development.

Exchange Integration and Liquidity Context
Exchange listings including platforms such as MEXC raised accessibility and discovery. Listing presence enhances exposure but does not guarantee sustained upward movement. Volume consistency determines structural resilience rather than announcement frequency. Recent sessions showed intermittent participation spikes followed by contraction, reinforcing compression narrative. Without synchronized ecosystem usage expansion, liquidity expansion alone struggles maintaining upward trajectory.
PI’s current range between $0.13 and $0.15 reflects equilibrium search rather than trend confirmation. Breakout attempts above resistance near moving average zones lacked sustained volume continuation. Technical neutrality persists until price closes decisively above that barrier.
Technical Structure: EMA Resistance and Volatility Compression
Technically, PI remains beneath its 50-day EMA, which acts as dynamic resistance. Momentum oscillators indicate flattening rather than bullish divergence confirmation. Volatility bands have tightened, historically signaling impending directional movement. Lower high formations reinforce caution until reversal structure invalidates that pattern. Historical contraction near 94% from speculative highs reset positioning across the participant base.
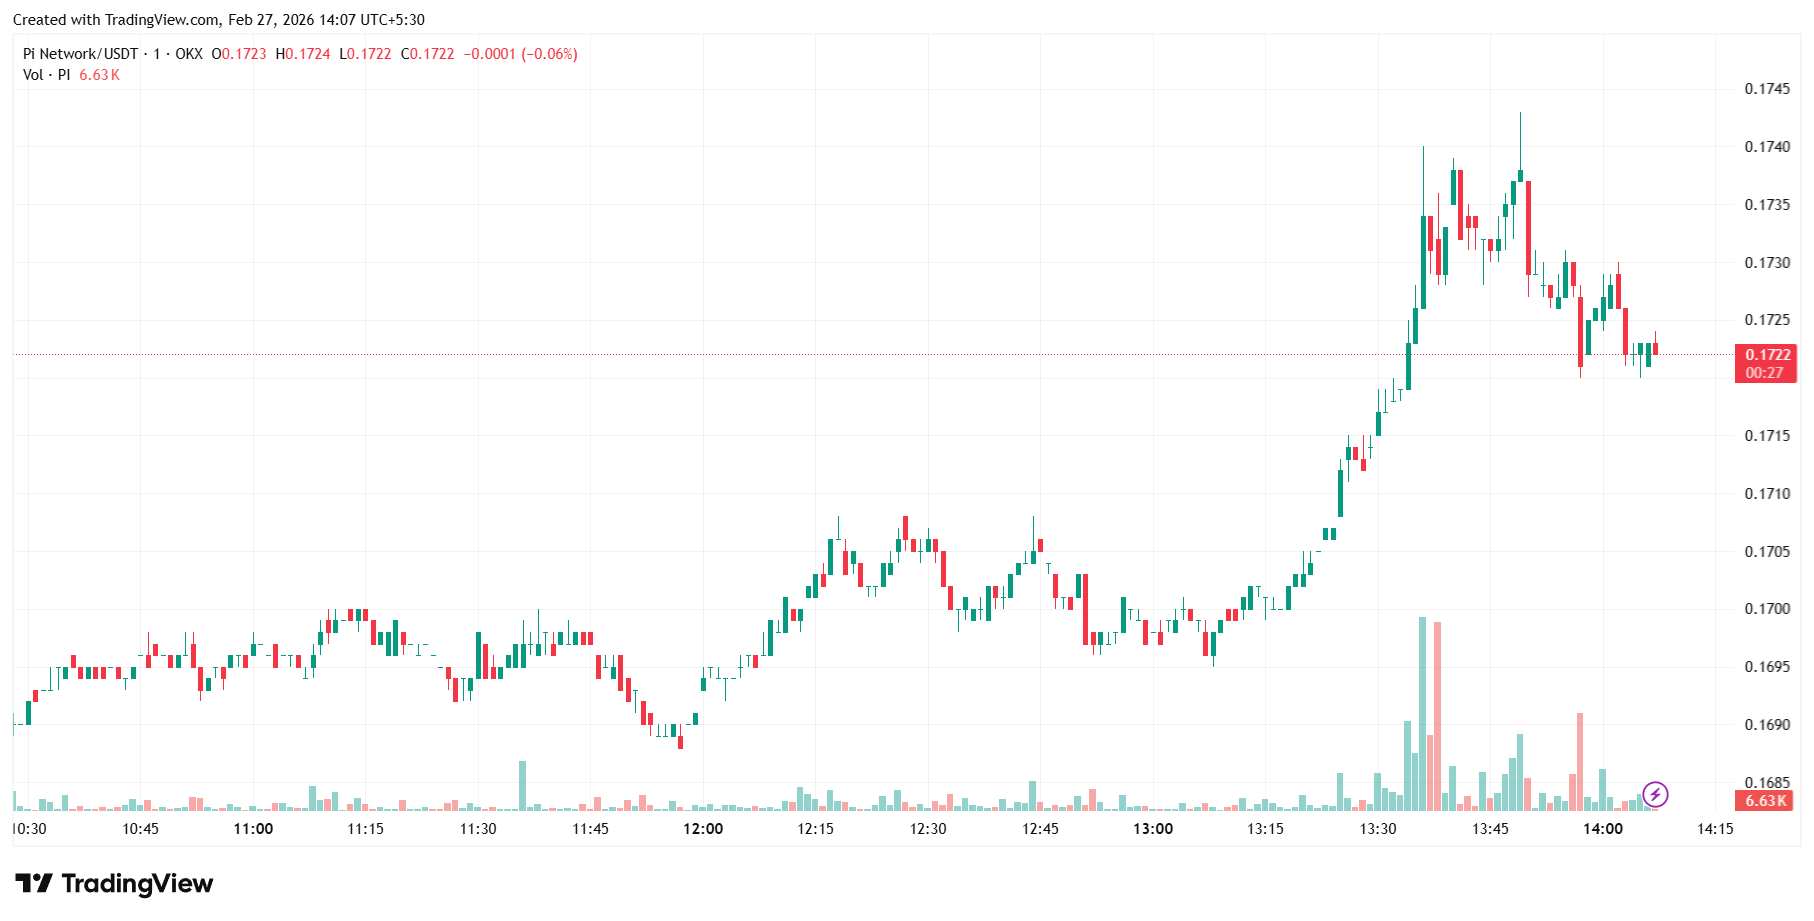
Source: Pi Network Chart on TradingView
Deep retracements often remove excess leverage and emotional exuberance, yet rebuilding confidence requires clear structural signals. Price behavior near $0.14 reflects market participants awaiting confirmation rather than aggressively accumulating. Sustained closes above EMA accompanied by strong volume would alter bias meaningfully. Until that occurs, consolidation bias remains intact.
Unlock Dynamics and Circulating Supply
Circulating expansion through unlock schedules remains a critical variable in the current phase. Transparent scheduling reduces shock volatility but does not eliminate absorption challenge.
Each incremental release requires corresponding demand participation to maintain equilibrium. When unlock pace exceeds organic demand expansion, price compression intensifies. Pi’s large community base theoretically provides absorption potential, yet participation intensity fluctuates with sentiment cycles.
Structural resilience depends on conversion from passive holders into active ecosystem participants. Supply mechanics exert mathematical pressure independent of narrative optimism. Therefore, equilibrium requires measurable traction rather than symbolic milestones.
Token Distribution Structure and Long-Term Circulation Modeling
Beyond immediate unlock schedules, long-term token distribution architecture ultimately determines whether an asset stabilizes, trends upward, or remains trapped in extended consolidation cycles. Tokenomics does not exert influence in a single event; it compounds gradually across months and years. Projects allocating significant portions toward ecosystem incentives, developer reserves, and contributor pools introduce multi-phase circulation expansion. Those allocations rarely enter markets instantly. Instead, they release through structured timelines that aim to reduce sudden shock events. Pi’s phased unlocking framework appears intentionally designed to avoid abrupt supply spikes that could destabilize price near the $0.13–$0.15 band. However, gradual release does not eliminate pressure — it distributes that pressure over time, and cumulative effect still impacts elasticity dynamics.
To evaluate long-term structural stability, several distribution variables must be examined simultaneously:
- Total maximum supply versus circulating supply ratio
- Monthly unlock velocity relative to average daily volume
- Percentage of tokens allocated to ecosystem development versus community incentives
- Historical absorption rate following prior unlock phases
- Concentration levels across top wallet clusters
Each of these metrics influences elasticity — the sensitivity of price to incremental supply changes. When elasticity remains high, even modest circulation rises can disproportionately depress price. In such environments, recovery attempts frequently stall near technical resistance zones, such as PI’s 50-day EMA barrier. When elasticity declines due to rising demand absorption, price resilience improves even during unlock windows. Therefore, elasticity modeling becomes central to forecasting whether current compression represents temporary equilibrium or precursor to prolonged consolidation.
Historical precedent across multiple blockchain ecosystems reveals consistent patterns. Networks that demonstrate measurable development in transaction density, dApp usage, and wallet activation often reduce elasticity over time. Rising activity strengthens organic absorption, limiting downside pressure during supply expansion. Conversely, ecosystems reliant primarily on sentiment-driven participation tend to maintain elevated elasticity. In those cases, unlock events amplify volatility rather than dissipate it. Pi’s current activity profile suggests transitional behavior rather than definitive elasticity compression, which explains persistent price hesitation near $0.14.
Long-term modeling must also incorporate liquidity depth expansion. As additional price movement venues integrate PI, order book structure can mature, widening bid-ask support and reducing slippage. Liquidity depth acts as structural shock absorber during unlock phases. The relationship operates as follows:
- Shallow liquidity + high unlock velocity = amplified volatility
- Moderate liquidity + steady unlock pacing = controlled compression
- Deep liquidity + rising activity = resilience against unlock pressure
Current liquidity conditions suggest moderate depth, sufficient for stability but not yet robust enough to absorb aggressive coordinated selling without short-term dislocation. That leaves price somewhat sensitive to sentiment waves, particularly during weaker macro crypto conditions.
Distribution modeling therefore cannot isolate supply alone. It must synthesize:
- Elasticity trends
- Liquidity trajectory
- Engagement conversion rates
- Exchange integration expansion
- Technical resistance behavior
- Macro crypto sentiment cycles
When these elements align positively, distribution phases often pass with minimal structural damage and eventually convert into expansion catalysts. When misaligned, extended sideways action becomes the dominant pattern. Pi presently occupies a mid-transition zone where structural groundwork continues forming, yet absorption strength has not fully matured to neutralize circulation expansion pressure. The coming quarters will determine whether elasticity compresses through rising ecosystem participation or remains elevated beneath technical resistance.
Compute Module and Hardware Expansion
Pi Compute Module powering open smartphone architecture introduces a differentiated strategic layer. Hardware adjacency expands ecosystem footprint beyond purely digital participation. Few mobile-focused blockchain ecosystems attempt embedded hardware experimentation at this scale.
Physical integration potentially strengthens identity and deepens developer engagement surface. However, hardware adoption cycles extend beyond token speculation timelines. Manufacturing logistics, distribution coordination, and user uptake require sustained execution. Hardware expansion raises optionality but does not instantly influence valuation metrics. Strategic diversification strengthens long-term positioning, though immediate price impact remains limited. Infrastructure depth improves resilience even during compression phases.
Ecosystem Tokens and Behavioral Architecture
Clarification around ecosystem token mechanics reinforced structured activation approach rather than abrupt liquidity surge. Badge mechanics segment participants and benefit sustained engagement behaviorally. Behavioral reinforcement systems frequently rise ecosystem stickiness across decentralized platforms.
Stickiness influences long-term participation more than temporary speculative spikes. Projects emphasizing layered engagement often demonstrate stronger durability across cycles. Pi’s architecture suggests long-term orientation toward ecosystem density rather than rapid valuation spikes. Market patience, however, rarely aligns perfectly with infrastructure timelines. That misalignment frequently generates volatility clusters.
Network Scale, Active Wallet Metrics, and Engagement Depth
One variable that requires deeper examination is actual network scale versus active engagement depth. Pi Network has historically cited tens of millions of registered participants globally, a figure that significantly exceeds many mid-cap blockchain ecosystems. However, raw registration numbers differ materially from active wallet engagement metrics. The meaningful analytical question centers on how many wallets actively transact, validate, or participate in ecosystem applications post–Open Network activation. Scale without activity produces dormant supply overhang. Activity without scale limits expansion potential. The equilibrium between these two variables determines whether a network transitions from symbolic betterment into measurable economic throughput.
Engagement depth influences price stability more than headline user counts. When a large percentage of wallets remain inactive, unlock events can introduce additional floating supply without corresponding transactional demand. Conversely, high engagement ratios strengthen absorption capability during circulation expansion phases. Analysts therefore monitor not only token distribution charts but also on-chain activity indicators, wallet activation patterns, and dApp usage frequency. If ecosystem applications demonstrate increasing transaction density, price resilience often improves despite broader volatility. If engagement stagnates while unlock schedules advance, compression tends to extend.
Recent ecosystem updates suggest structural groundwork continues forming, yet publicly visible transaction metrics remain moderate relative to community size. This disparity creates optionality. If engagement conversion accelerates, current price zones could represent structural base formation. If conversion remains gradual, consolidation may persist longer than participants anticipate. Network scale alone does not guarantee valuation expansion. Engagement intensity determines whether scale transforms into sustained economic throughput.
Analytical Contrast With Minotaurus (MTAUR)
While PI navigates open-market compression between $0.13 and $0.15 beneath EMA resistance, alternative structural models operate differently. Minotaurus (MTAUR) follows stage-based progression before listing exposure, introducing arithmetic transparency into allocation sequence.
Current MTAUR level stands at 0.0001268 USDT, with the next stage positioned at 0.00014 and listing benchmark defined at 0.00020000 USDT. The differential between 0.00012678 and 0.00020000 USDT equals approximately 57.8%. That differential derives from predefined stage structure rather than speculative breakout forecasting.
Participants evaluating positioning can calculate outcome visibility without relying on moving average signals or volume spikes. Structured increments reduce exposure to unpredictable intraday volatility typical in open markets.
Why Stage-Based Arithmetic Draws Attention During Compression
During compression environments like PI’s current $0.13–$0.15 range beneath resistance, participants often reassess allocation frameworks. Open-market volatility requires probabilistic analysis dependent on breakout confirmation. Stage-based progression introduces deterministic sequencing prior to exchange listing. Deterministic arithmetic often appeals during uncertainty because the differential remains visible without technical ambiguity. PI recovery above EMA requires sustained volume confirmation and unlock absorption alignment. MTAUR stage movement depends on milestone completion and allocation thresholds. Structural clarity alters behavioral calculus. Analytical interest in stage-based models tends to increase when major assets experience consolidation rather than expansion.
Utility Architecture Comparison
PI focuses on mobile-first onboarding, badge-based behavioral reinforcement, ecosystem token layering, and hardware experimentation. MTAUR integrates functionality within maze-based progression mechanics, embedding token usage into gameplay structure. Embedded utility often strengthens internal demand consistency relative to purely narrative cycles. PI’s large-scale community creates scale advantages, yet scale amplifies unlock pressure and sentiment volatility. MTAUR’s structured progression offers arithmetic clarity prior to listing exposure. Different structural paths reflect distinct risk profiles. Open-market volatility offers rapid upside potential but equal downside exposure. Stage-based models reduce immediate volatility yet depend on successful listing transition.
What Must Occur Next for PI
For PI to shift from compression toward expansion, several factors must align simultaneously. Sustained close above 50-day EMA resistance would mark technical improvement. Volume expansion must accompany breakout to confirm structural conviction. Unlock absorption needs demonstrating equilibrium rather than excess circulation pressure. Ecosystem application traction must show measurable usage development beyond badge participation. Hardware experimentation must progress beyond prototype signaling into adoption metrics. Without alignment across these dimensions, consolidation likely persists near the current $0.13–$0.15 band. Breakout scenarios require synchronized catalyst convergence rather than isolated announcements.
Broader Market Context and Final Perspective
Crypto markets increasingly benefit structural clarity over speculative spikes. Infrastructure maturity, participation architecture, and supply mechanics now shape evaluation frameworks. PI contributes large-scale onboarding experimentation combined with ecosystem layering. Current price near $0.14 reflects transitional recalibration rather than definitive structural failure. Compression phases historically precede significant directional movement once equilibrium resolves.
Simultaneously, structured stage-based ecosystems like Minotaurus present arithmetic transparency that attracts analytical scrutiny during volatile macro conditions. Both models represent evolving architectural philosophies within digital assets. One operates through open-market volatility; the other through predefined stage sequencing. Transitional cycles frequently define longer-term leadership trajectories. Whether PI reclaims upward momentum or extends consolidation depends on structural alignment rather than narrative momentum alone.
Disclaimer: This is a Press Release provided by a third party who is responsible for the content. Please conduct your own research before taking any action based on the content.
Get 3 Free Stock Ebooks
Discover top-performing stocks in AI, Crypto, and Technology with expert analysis.
- Top 10 AI Stocks - Leading AI companies
- Top 10 Crypto Stocks - Blockchain leaders
- Top 10 Tech Stocks - Tech giants


