
 Price: New Highs on the Horizon as Short Sellers Face $1M Liquidation")
TLDR
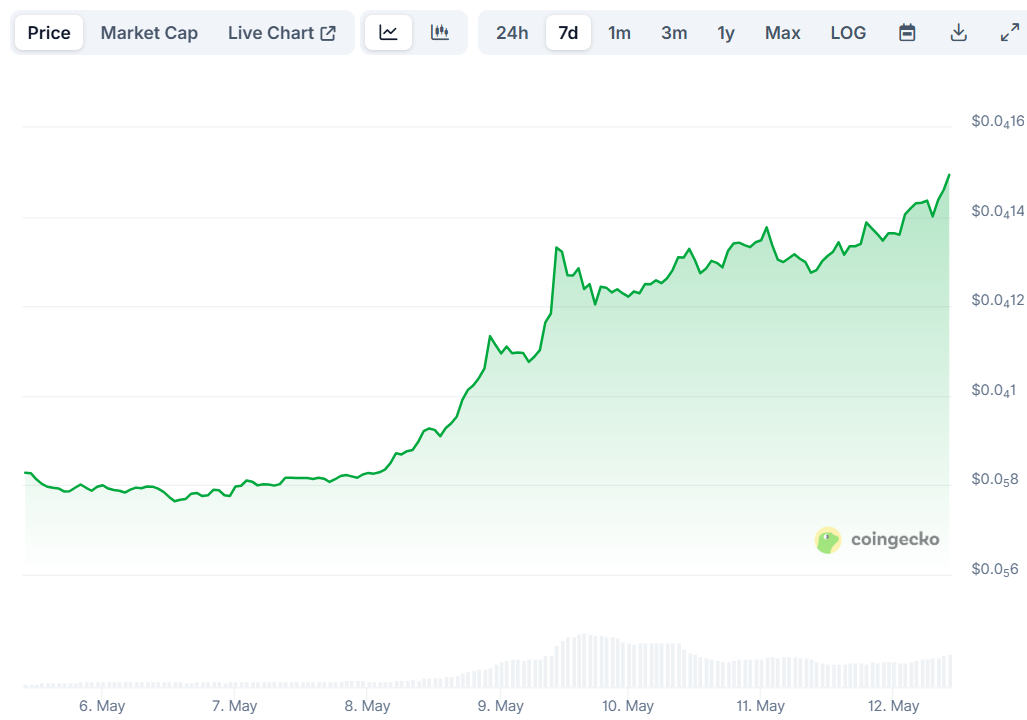
- PEPE coin price jumped 7% to hit $0.00001453, continuing a 68% growth from the previous week
- Short liquidations topped $1.14M in just 4 hours on May 12, 2025
- Open Interest in PEPE futures approached $600M, reaching a new all-time high
- Despite $10.52M net exchange inflow, bulls absorbed selling pressure
- Technical analysis shows potential for continued rally, targeting $0.000016 level
PEPE coin is making waves in the crypto market with its recent price surge. The frog-themed meme coin jumped about 7% to reach $0.00001453 on May 12, 2025. This continues the strong momentum from last week when PEPE saw a 68% price increase.
The price level of $0.00001453 hasn’t been seen since January 31, marking a 100-day high for the cryptocurrency.
Short sellers betting against PEPE found themselves in trouble as the price rally forced liquidations of $1.14 million worth of bearish positions in just four hours.
This bullish price action comes as PEPE’s open interest in futures markets nears $600 million, reaching a new all-time high of $595.36 million on Monday according to CoinGlass data.
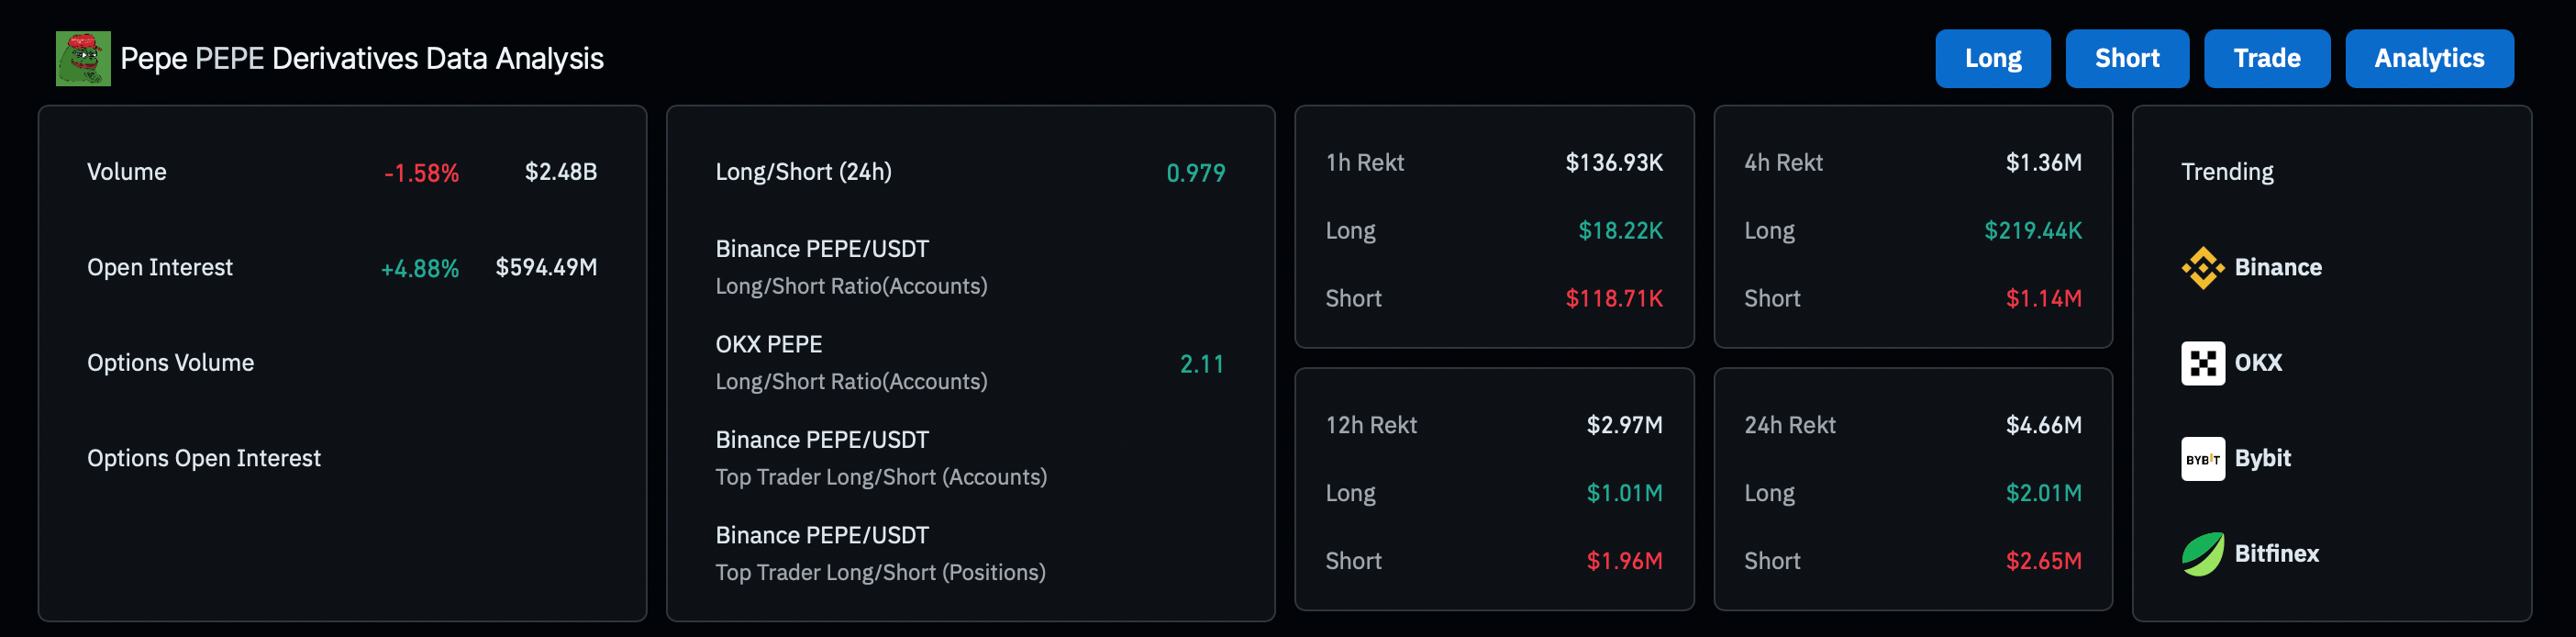
The increasing open interest shows new money entering the market, which could help fuel PEPE’s ongoing rally.
Another positive indicator is the long-to-short ratio, which stands at 1.09 – the highest level in over a month. A ratio above one suggests bullish market sentiment as more traders bet on price increases.

Technical Analysis Points to Further Gains
From a technical perspective, PEPE has broken through several key levels. The price has surpassed the 200-day Exponential Moving Average (EMA) and the 61.80% Fibonacci level at $0.00001426.
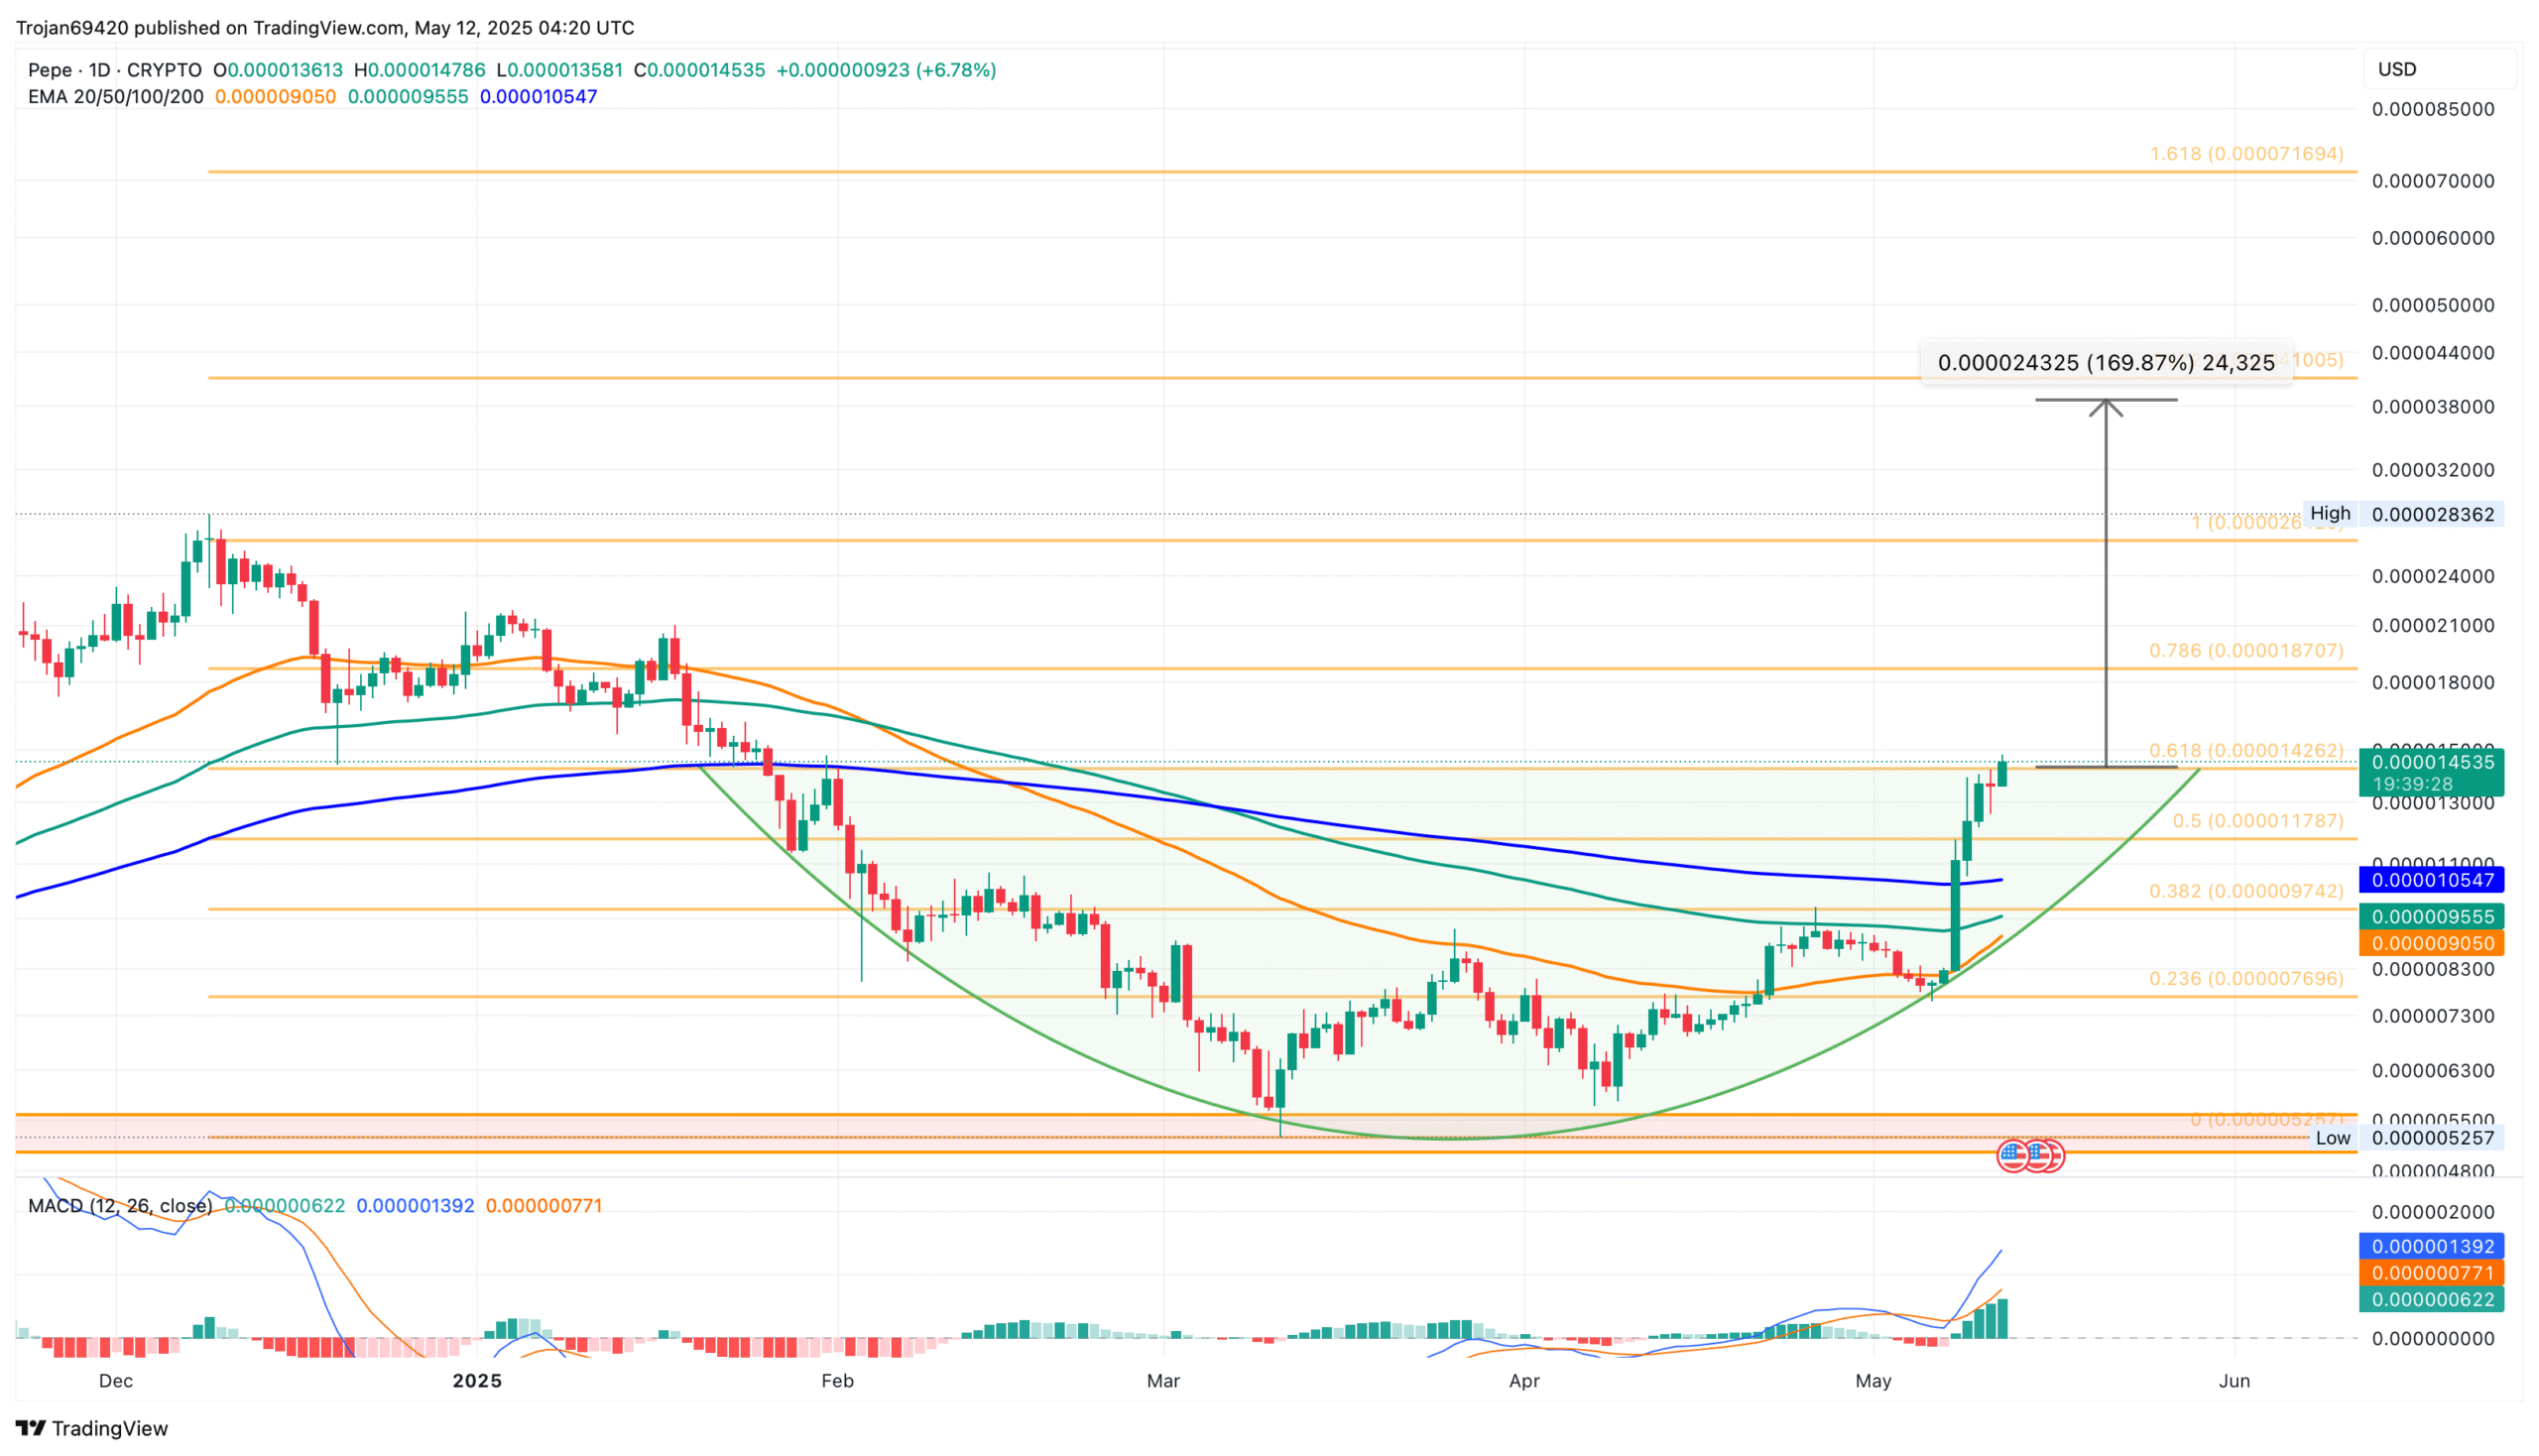
PEPE’s chart shows a rounding bottom pattern formation. This occurs after the price fell nearly 60% from $0.00001386 to $0.000005698 between February 1 and March 10, 2025.
The neckline of this pattern sits at the 61.80% Fibonacci level. A daily close above $0.00001426 would confirm the breakout, potentially leading to further gains.
Based on the Fibonacci retracement tool, the 100% level at $0.00002649 represents a possible 75% rise from current levels.
However, traders should note potential resistance at the 78.60% Fibonacci level near $0.00001870, which could slow PEPE’s advance toward a new all-time high.
The daily chart’s Relative Strength Index (RSI) has moved above 70, indicating strong bullish momentum but also suggesting the coin is in overbought territory.
Exchange Flows Show Strong Demand
On-chain data reveals an interesting dynamic between short-term profit-takers and long-term holders.
According to Coinglass data, PEPE saw a net inflow of $10.52 million into exchanges on May 12, following an $18.55 million inflow last week.
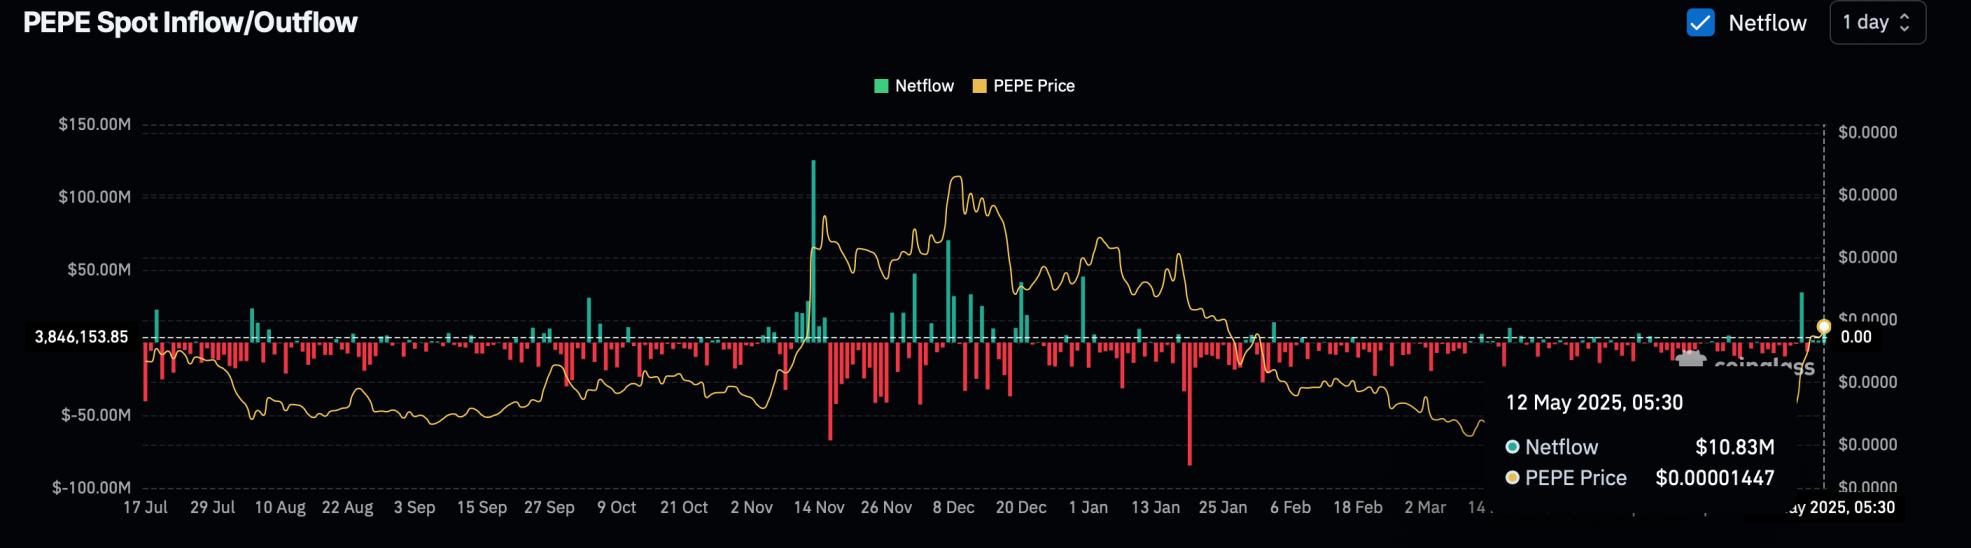
Despite this supply increase, PEPE’s rally continues as buyers absorb the selling pressure, demonstrating the underlying strength of bulls in the market.
IntoTheBlock data shows that the average holding time of transacted coins remains under one month for the last couple of weeks. This suggests short-term traders are booking profits while long-term holders remain on the sidelines.
If PEPE continues its upward trend, it could extend the rally to test the next daily resistance at $0.000016. A successful close above this level might push prices toward the January 18 high of $0.000021.
On the downside, if PEPE faces a pullback, support is expected at the $0.000013 level. A break below the 38.20% Fibonacci level near $0.000010 would nullify the reversal pattern, with the next support at $0.000007669.
At the time of writing, PEPE trades 5% higher at around $0.000014, continuing to build on its recent momentum.
Get 3 Free Stock Ebooks
Discover top-performing stocks in AI, Crypto, and Technology with expert analysis.
- Top 10 AI Stocks - Leading AI companies
- Top 10 Crypto Stocks - Blockchain leaders
- Top 10 Tech Stocks - Tech giants


