
 Retreats 22% — Is the $50-$54 Support Zone a Strategic Entry Point?")
Key Takeaways
- HYPE has retraced 22% from its $76.9 all-time high, now hovering near $66
- Critical support zone between $50 and $54 coincides with the 50-day EMA
- Open interest declined from $2.2 billion to $1.73 billion, indicating reduced trading activity
- Spot market pressure is declining, though spot CVD stays negative at -$95 million
- Trader Altcoin Sherpa identifies $55–$64 as favorable accumulation territory with $100 price target
The Hyperliquid HYPE token has experienced a 22% decline from its all-time peak of $76.9 established last week. Currently positioned around $66, market participants are evaluating whether the upward trajectory initiated in January remains viable.
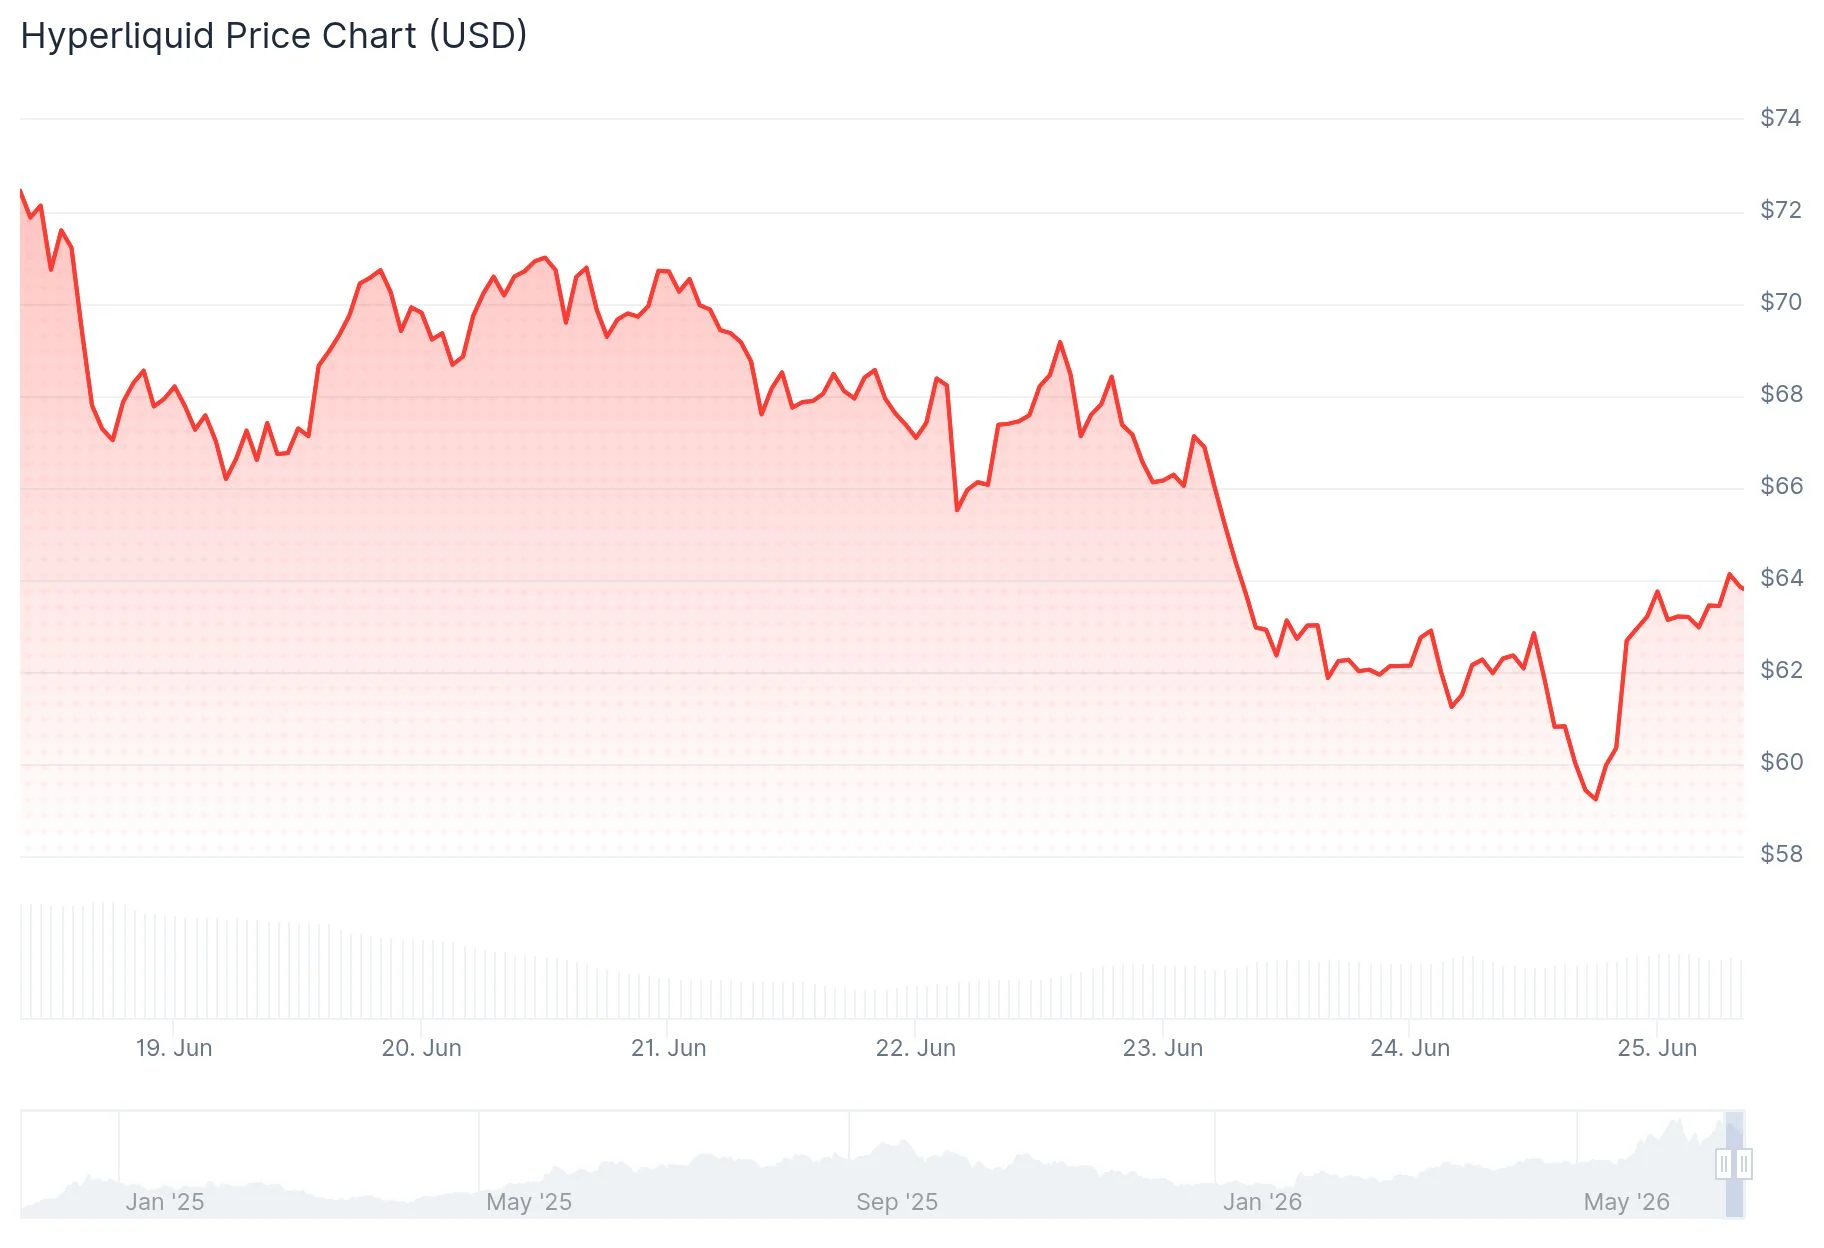
The pullback commenced after price rejection occurred near the $76 all-time high. HYPE dipped beneath $60 during the middle of the week before finding stabilization. The 50-day exponential moving average, which has provided trend support during the entire March rally, is currently undergoing a critical test.
Derivatives metrics continue to exhibit bullish characteristics. According to CoinGlass, the long-to-short ratio stands at 1.03, accompanied by positive funding rates of 0.0042%. This configuration indicates that long position holders are compensating short sellers, suggesting market expectations for continued price appreciation.
Spot Market Pressure Showing Signs of Relief
Selling activity in the spot market has diminished compared to early June intensity. The aggregated spot cumulative volume delta (CVD) has recovered from recent nadirs, although it maintains a substantially negative position around -$95 million. Throughout the decline from $76 in early June, spot selling pressure escalated to $110 million.
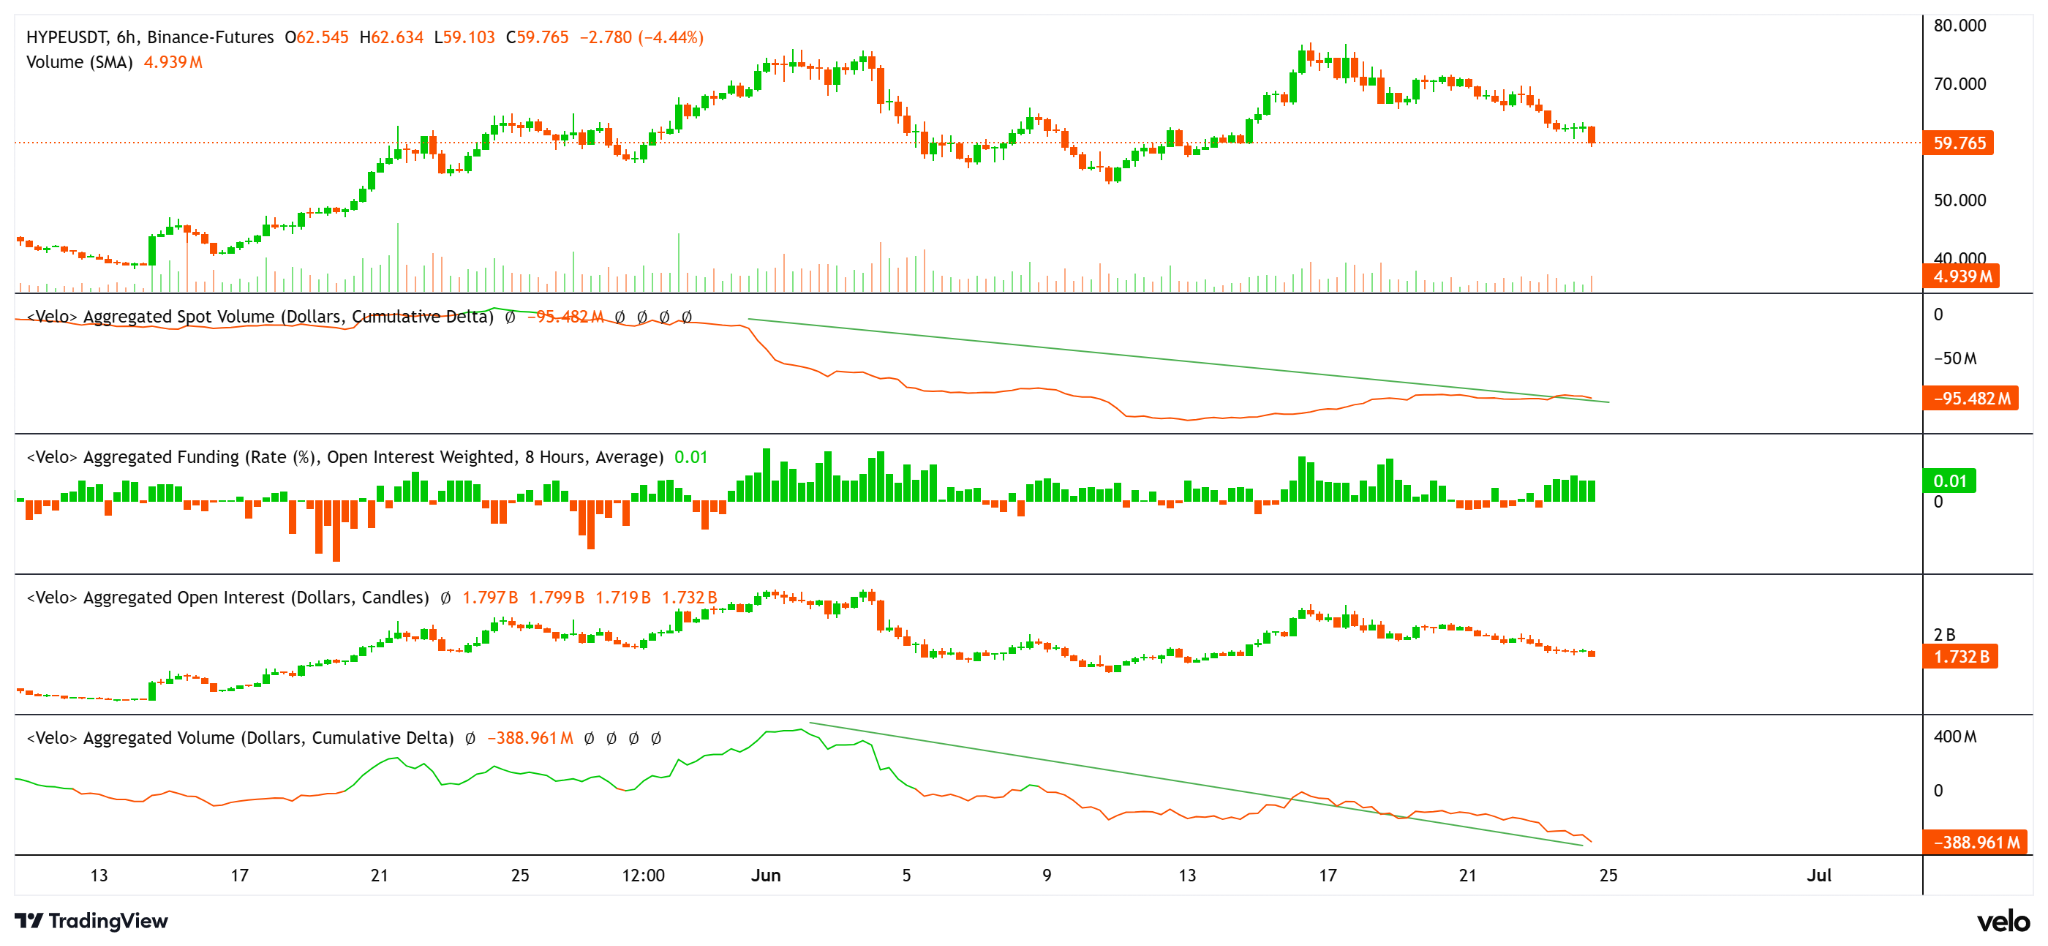
The derivatives landscape presents a more reserved outlook. Open interest has contracted from $2.2 billion to $1.73 billion. Derivatives CVD registers near -$389 million. Market participants appear to be reducing exposure rather than establishing fresh positions.

Social dominance metrics for HYPE have trended downward since June 17, currently registering 0.175% per Santiment data. Retail engagement has intensified following the record peaks, which certain analysts interpret as a potential warning signal for short-term momentum sustainability.
Spot ETF capital flows have remained subdued this week, with SoSoValue data indicating minimal institutional participation.
$50–$54 Region Emerges as Pivotal Support Territory
The subsequent significant support area resides between $50 and $54. The ascending 50-day EMA converges with an unfilled daily fair-value gap within this range. A daily closing price below $53 would represent the first bearish structural shift on the daily timeframe this year.
Beneath that threshold, the 100-day EMA at $51.57 provides the next defensive level, followed by $49. More substantial support exists near $38.
Cryptocurrency analyst Altcoin Sherpa offered his perspective on the current market structure: “HYPE, I think anywhere in the 55–64 area is a pretty good place to accumulate this one. I think it goes to $100 later this year personally and is still the best altcoin…but it’s going to also depend a lot on bitcoin IMO.”
Regarding upside potential, a daily close exceeding $74.60 would reestablish the trajectory toward fresh all-time highs. The 50-day EMA currently positions at $58.94, the 100-day at $51.57, and the 200-day at $44.68, all tracking below current price and indicating a preserved underlying uptrend structure.
The Relative Strength Index registers approximately 53 on the daily chart, while the MACD indicator displays slight negativity, suggesting momentum deceleration without transitioning to bearish territory.
Get 3 Free Stock Ebooks
Discover top-performing stocks in AI, Crypto, and Technology with expert analysis.
- Top 10 AI Stocks - Leading AI companies
- Top 10 Crypto Stocks - Blockchain leaders
- Top 10 Tech Stocks - Tech giants


