

Key Takeaways
- The precious metal is experiencing its steepest quarterly drop since 2013, plummeting approximately 24% from its January high.
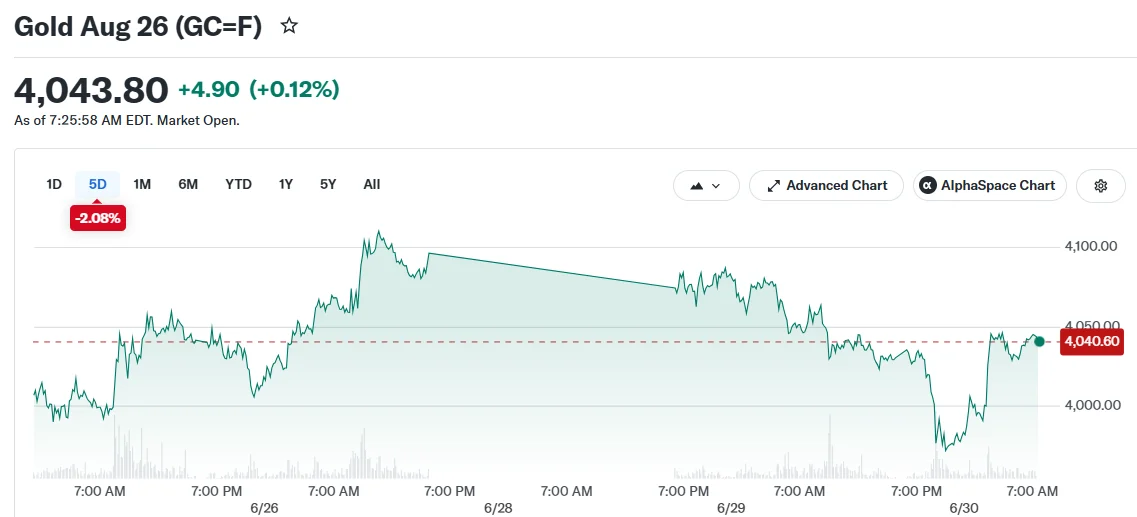
- Gold Futures hovered around $4,031.70, following a brief drop below the $4,000 mark for the first time since November 2025.
- The U.S. Dollar Index approaching a 13-month peak combined with increased Federal Reserve rate-hike expectations are fueling the decline.
- Market options pricing reveals traders are purchasing downside hedges over upside calls for the first time since 2016.
- Despite current weakness, Goldman Sachs maintains a forecast of $4,900 gold by end-2026, supported by central bank buying.
The precious metals market has witnessed a dramatic downturn in recent months, with gold experiencing its most severe quarterly decline in over a decade.
The yellow metal has plunged approximately 24% from its late-January peak of nearly $5,589 per ounce. As of Tuesday, August delivery Gold Futures were changing hands at $4,031.70.
Earlier during the trading week, the metal slumped to a fresh seven-month bottom at $3,941. Prices managed to claw back some losses, hovering near $4,028 as trading sessions commenced.
Key Factors Behind the Decline
The primary catalyst for the selloff has been the robust performance of the U.S. Dollar. The greenback’s index is currently trading at levels not seen in 13 months.
When the dollar appreciates, gold becomes costlier for international buyers, which dampens global demand and exerts downward pressure on valuations.

Market participants are also factoring in an elevated likelihood of Federal Reserve monetary tightening. According to the CME FedWatch Tool, there’s a 63% chance of a rate increase at the September policy meeting.
Since gold doesn’t offer any yield, rising interest rates typically diminish its appeal compared to income-generating investments.
Inflationary concerns stemming from ongoing Middle East tensions have compounded the uncertainty. Elevated energy prices have lifted inflation projections, reinforcing a more aggressive Fed policy stance.
Market attention will be laser-focused on this week’s employment indicators. The JOLTS report, ADP Employment Change figures, and Nonfarm Payrolls data are all scheduled for release ahead of the July 4th holiday weekend.
Robust employment figures could propel the dollar to further gains, potentially intensifying downward pressure on gold as the third quarter begins.
Options Market Signals Shifting Sentiment
Trader positioning in the gold derivatives market has undergone a notable transformation. For the first time in eight years, put option premiums for gold have exceeded call option costs.
This dynamic indicates that market participants are allocating more capital toward downside protection rather than wagering on a price recovery.
Samantha Dart, Goldman Sachs’ commodity co-head, highlighted this rotation as evidence of evolving market sentiment. She noted that demand has shifted from energy-related bullish positions toward defensive gold puts.
Nevertheless, Dart maintains that gold’s long-term trajectory remains constructive. In a research note dated June 29, she emphasized that fundamental structural and economic drivers should support higher valuations later this year.
Goldman Sachs officially projects gold will climb to $4,900 by year-end 2026, implying a potential gain of roughly 21% from present levels.
An OMFIF survey of 90 central banks and sovereign investment entities, published June 30, revealed a meaningful pivot away from dollar-denominated reserves. For the first time, more institutions indicated plans to decrease rather than increase dollar holdings over the coming decade.
A net 30% of respondents stated they intend to boost gold allocations within the next one to two years.
Gold has also diminished as a portfolio hedge against equity market volatility. Earlier this year, the metal exhibited inverse correlation with stocks during periods of market turbulence. That relationship has now reversed, with gold increasingly tracking equity movements.
From a technical perspective, gold is trading beneath its 50-day, 100-day, and 200-day moving averages, which are clustered in the $4,440 to $4,660 range. Market analysts suggest a sustained break below $4,000 could trigger additional selling pressure, with subsequent support zones identified near $3,885 and $3,750.
Get 3 Free Stock Ebooks
Discover top-performing stocks in AI, Crypto, and Technology with expert analysis.
- Top 10 AI Stocks - Leading AI companies
- Top 10 Crypto Stocks - Blockchain leaders
- Top 10 Tech Stocks - Tech giants


