

TLDR
- Ethereum forms a Wave (3) setup with $4,800–$5,000 as the key resistance zone.
- ETHBTC tests the multi-year trendline from the 2017 and 2021 highs for a breakout.
- Support sits at $3,850–$3,900, while resistance remains near $5,000.
- A break above 0.06–0.07 ETHBTC could trigger renewed Ethereum dominance.
Ethereum is showing signs of renewed strength against Bitcoin after nearly four years of relative underperformance. The Ethereum to Bitcoin ratio (ETH/BTC) has approached a critical point on the long-term chart, where previous breakouts have often marked major shifts in market dominance. Recent technical patterns and price behavior suggest that Ethereum may be entering a new bullish phase, potentially signaling a broader rotation within the cryptocurrency market.
Ethereum Forms Higher Low as Bullish Structure Builds
Ethereum’s daily chart shows a steady rebound from the $3,850 support zone, confirming a higher low formation that aligns with the early stage of a Wave (3) expansion. The market remains in consolidation between $3,950 and $4,200, an area that corresponds with key Fibonacci retracement levels from the previous uptrend.
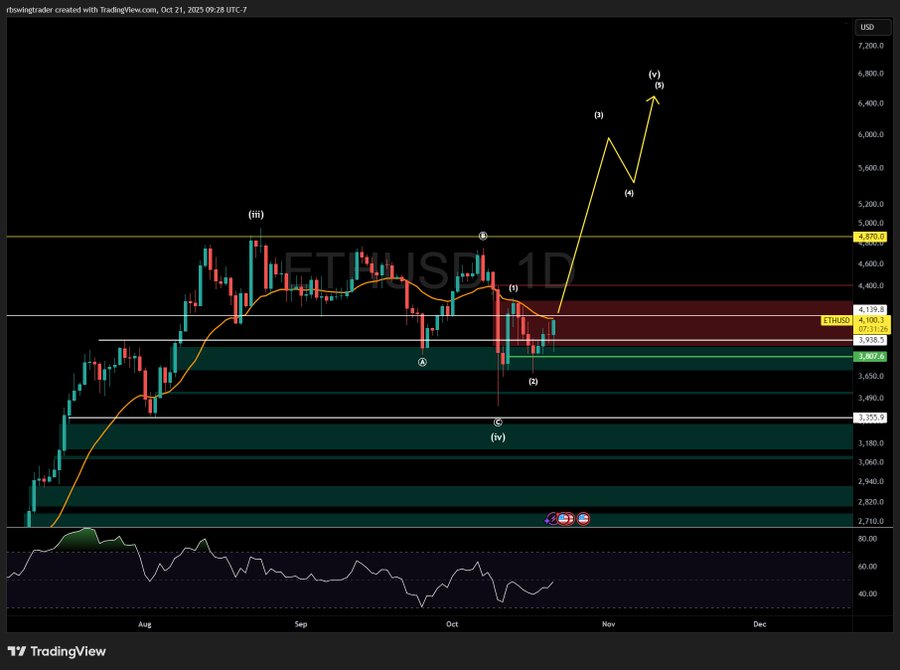
ETH/USD 4H Chart | Source: X
Momentum indicators are beginning to strengthen. The RSI has recovered from oversold territory, hinting that bullish pressure may continue building in the near term. Sustained accumulation above the 50-day moving average could further confirm that Ethereum’s corrective phase has ended, positioning the asset for a potential rally toward $6,000–$6,400 in the following impulse wave.
The ETHBTC Pair Approaches a Long-Term Breakout Zone
Furthermore, on the ETH/BTC chart, Ethereum’s ratio to Bitcoin has been trapped within a multi-year descending trendline since its 2021 cycle peak. This same pattern has defined Ethereum’s relative performance since 2017, when the ratio first topped near 0.16 before entering a prolonged correction. The repeated interaction with the long-term resistance now places the pair near a decisive breakout level. A confirmed move above the 0.06–0.07 range could validate a reversal and set the stage for renewed Ethereum dominance.
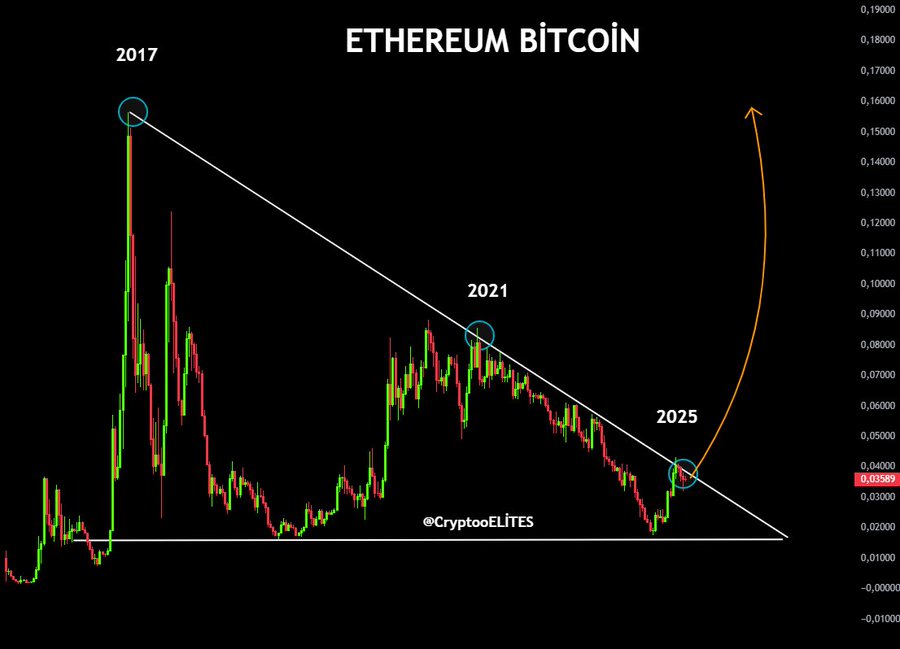
ETH/USD 1M Chart | Source: X

Historically, these breakouts have aligned with major capital rotations from Bitcoin into Ethereum and other large-cap altcoins. A breakout would likely push the ratio toward the 0.10–0.12 zone, levels last seen during the 2021 bull market. Analysts believe this shift could coincide with a new phase of network growth, institutional participation, and increased liquidity within Ethereum-based markets.
Historical Patterns Suggest a Potential Shift in Market Leadership
Moreover, Ethereum’s past performance shows a cyclical rhythm. When ETH/BTC breaks above its long-term resistance, Ethereum typically outpaces Bitcoin during the later stages of the market cycle. This pattern occurred in both 2017 and 2021, where ETH gained substantial ground after breaking through similar descending structures.
Beyond price action, this rotation often reflects expanding network utility and investor confidence. Ethereum continues to attract developers, institutional investors, and DeFi projects, strengthening its case for relative outperformance. Still, caution remains failure to sustain above the resistance trendline could extend the current consolidation, keeping Ethereum’s dominance subdued near 0.03–0.035 for several more months.
Traders Eye 2025 as a Defining Year for Ethereum’s Market Position
Consequently, with both ETH/USD and ETH/BTC charts showing technical alignment, attention is turning to 2025 as a potentially defining year for Ethereum’s trajectory. A confirmed breakout could echo the post-2017 and post-2021 expansions, positioning Ethereum for renewed dominance within the broader crypto market.
While the bullish setup remains promising, the next few weeks will be pivotal. Holding key support near $3,850 while breaking $4,200 would likely confirm upward continuation. Conversely, losing momentum could postpone the breakout. Either way, Ethereum’s structure is tightening, and for many traders, that usually signals that a major move is just ahead.
Get 3 Free Stock Ebooks
Discover top-performing stocks in AI, Crypto, and Technology with expert analysis.
- Top 10 AI Stocks - Leading AI companies
- Top 10 Crypto Stocks - Blockchain leaders
- Top 10 Tech Stocks - Tech giants


